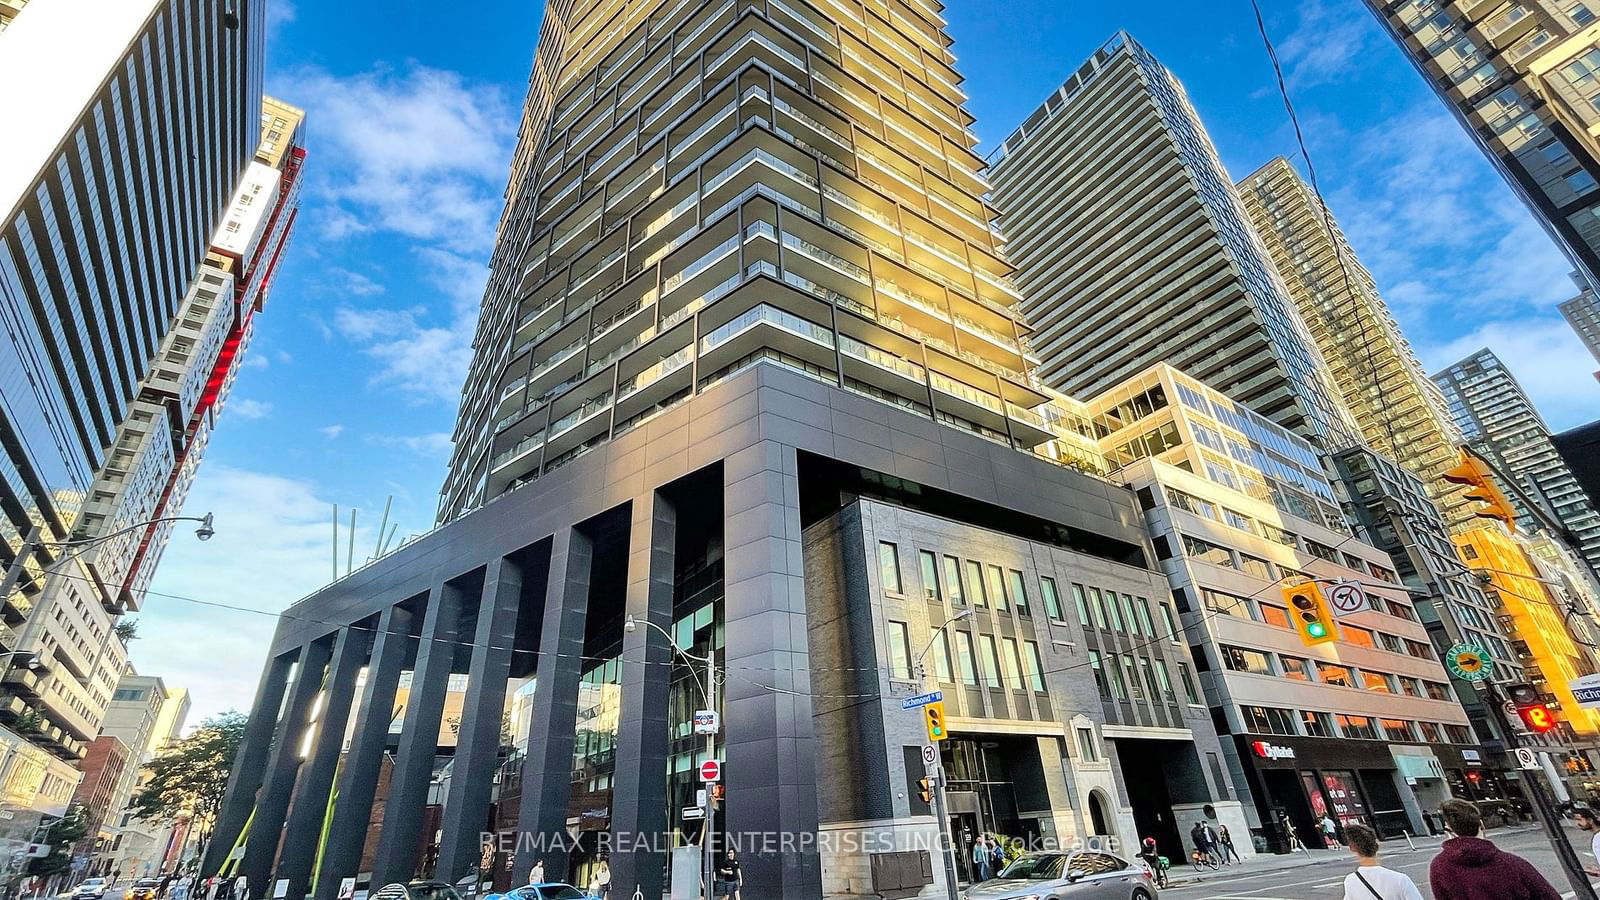
1301 - 125 Peter St
Listing History
Unit Highlights
Maintenance Fees
Utility Type
- Air Conditioning
- Central Air
- Heat Source
- Gas
- Heating
- Forced Air
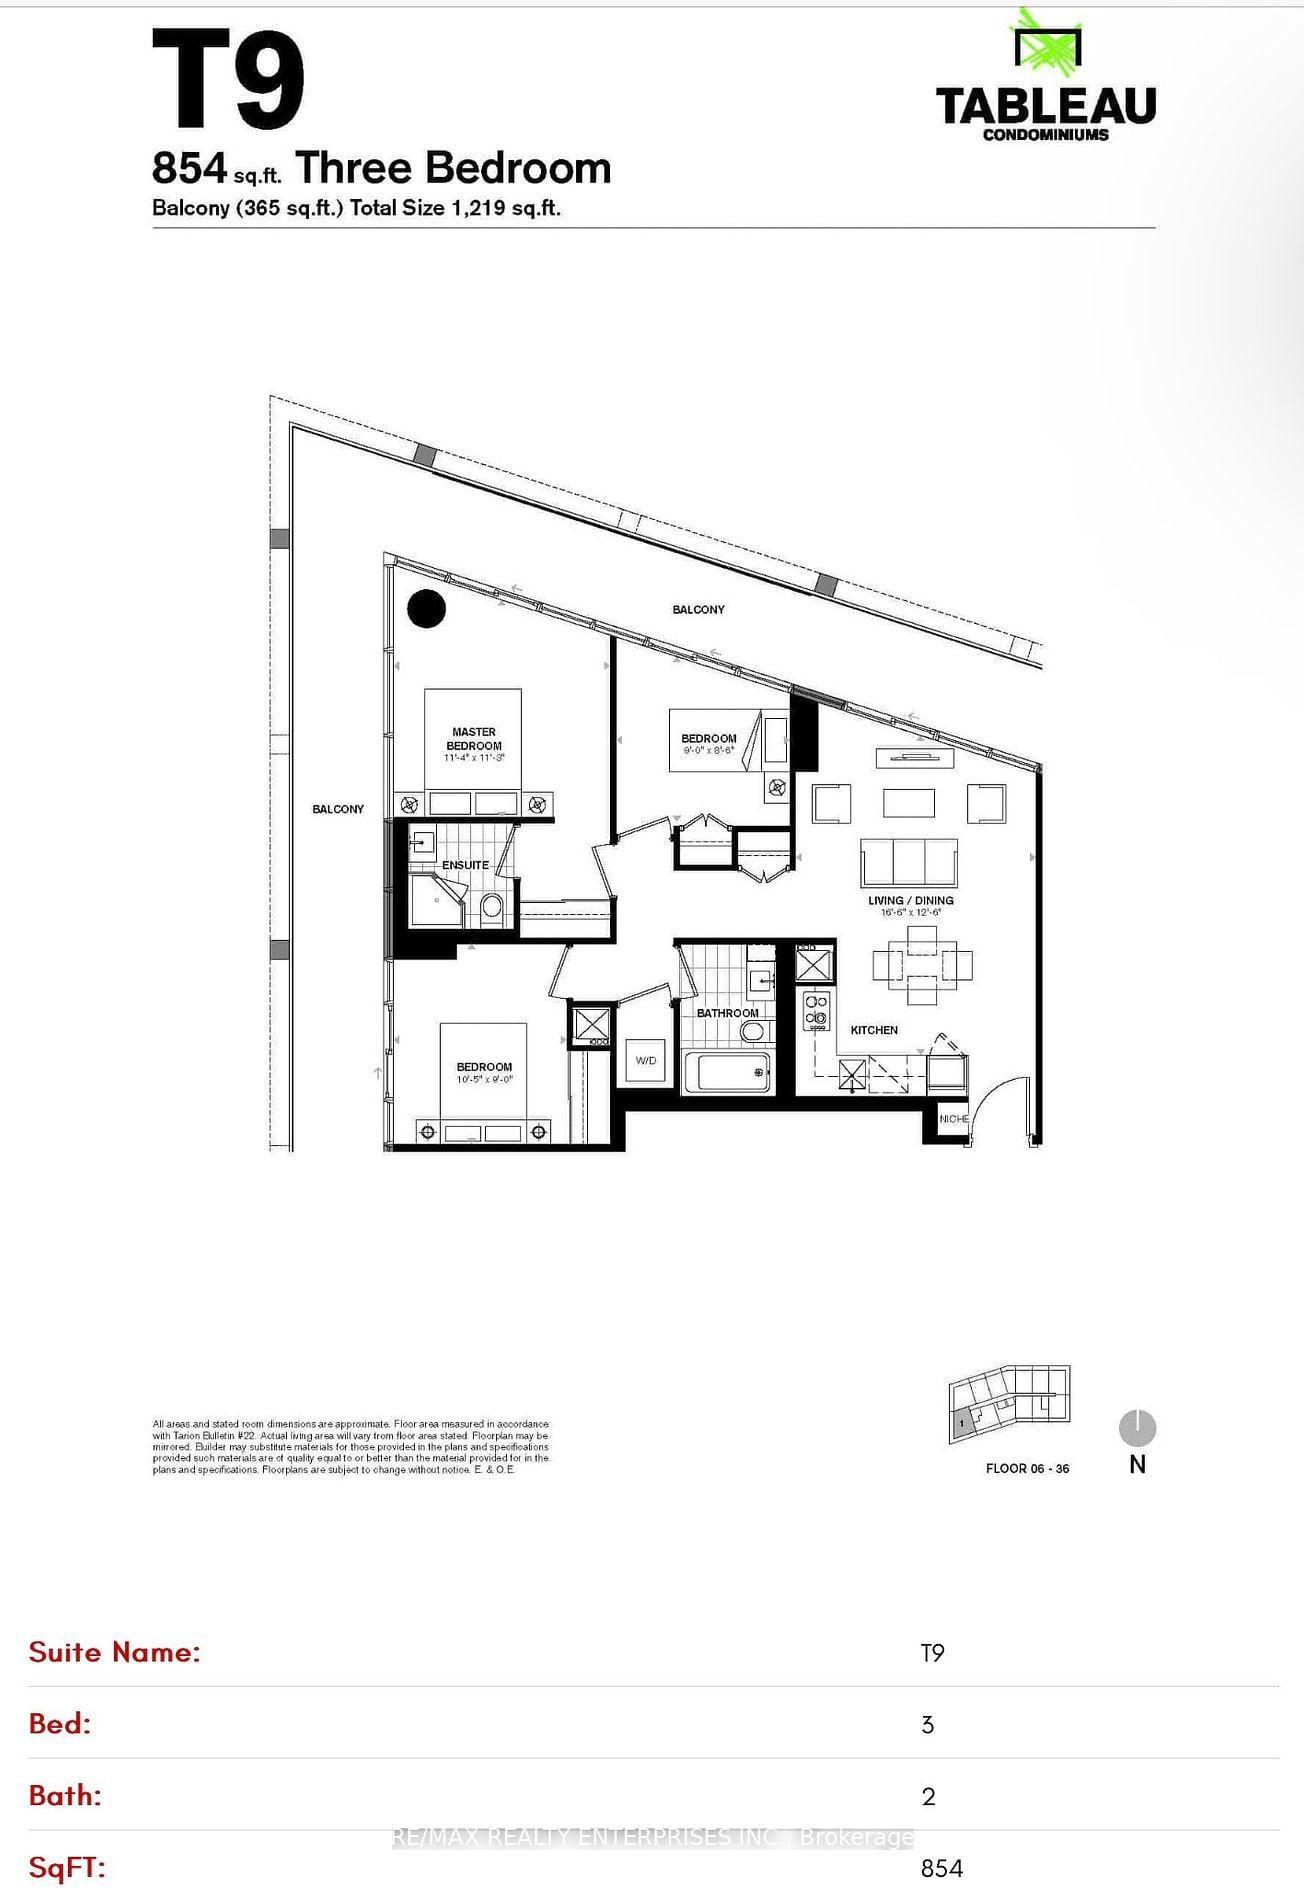
Room Dimensions
About this Listing
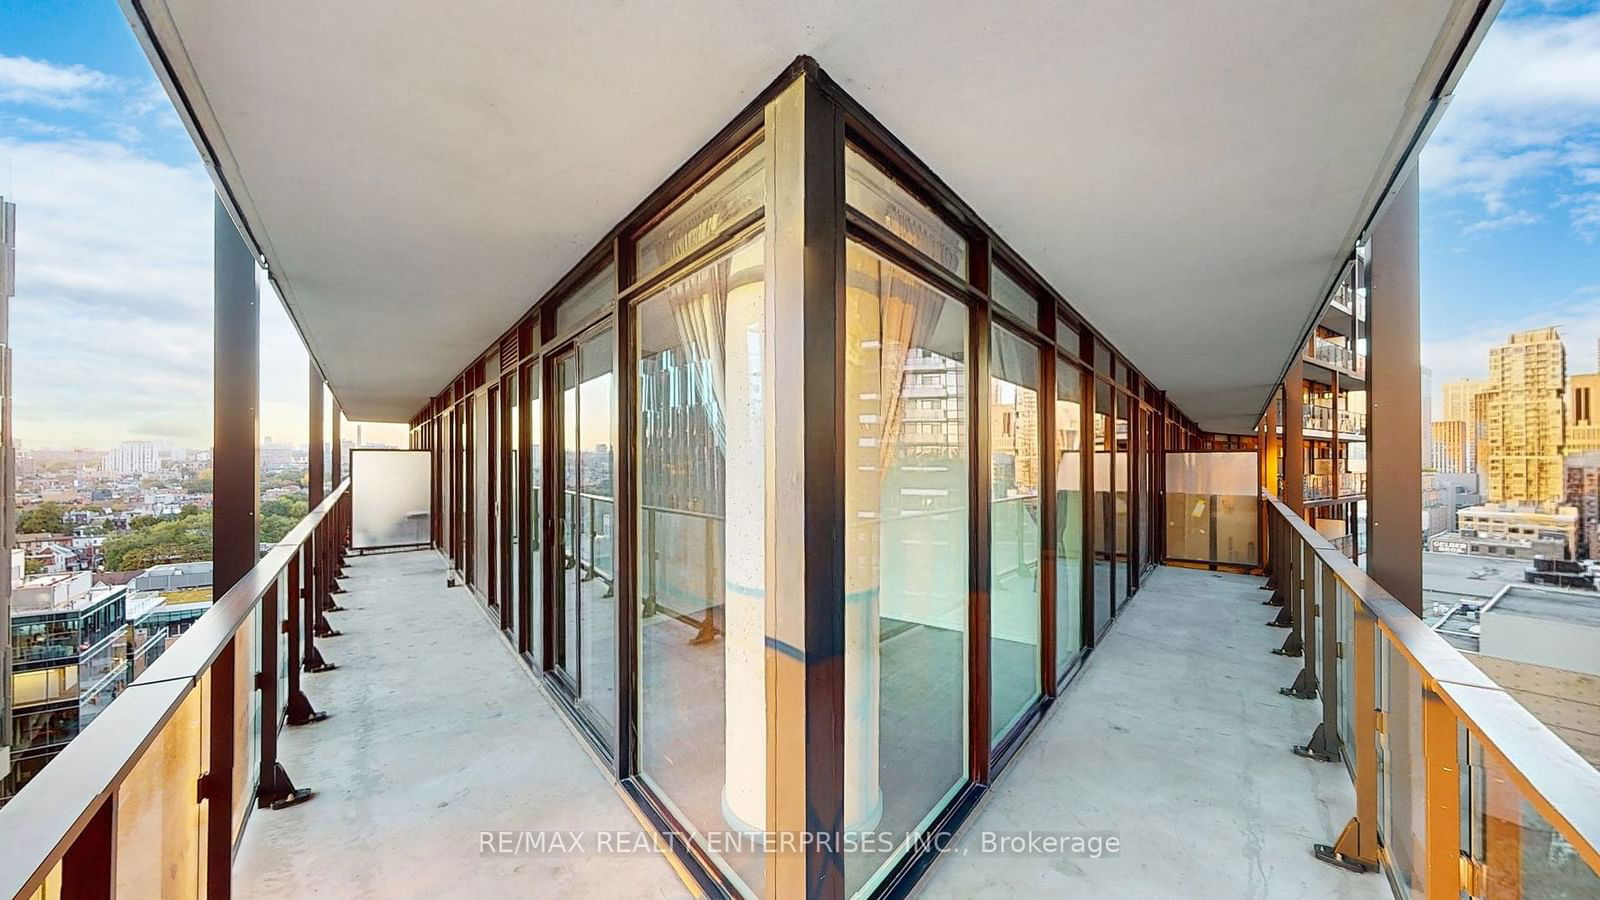
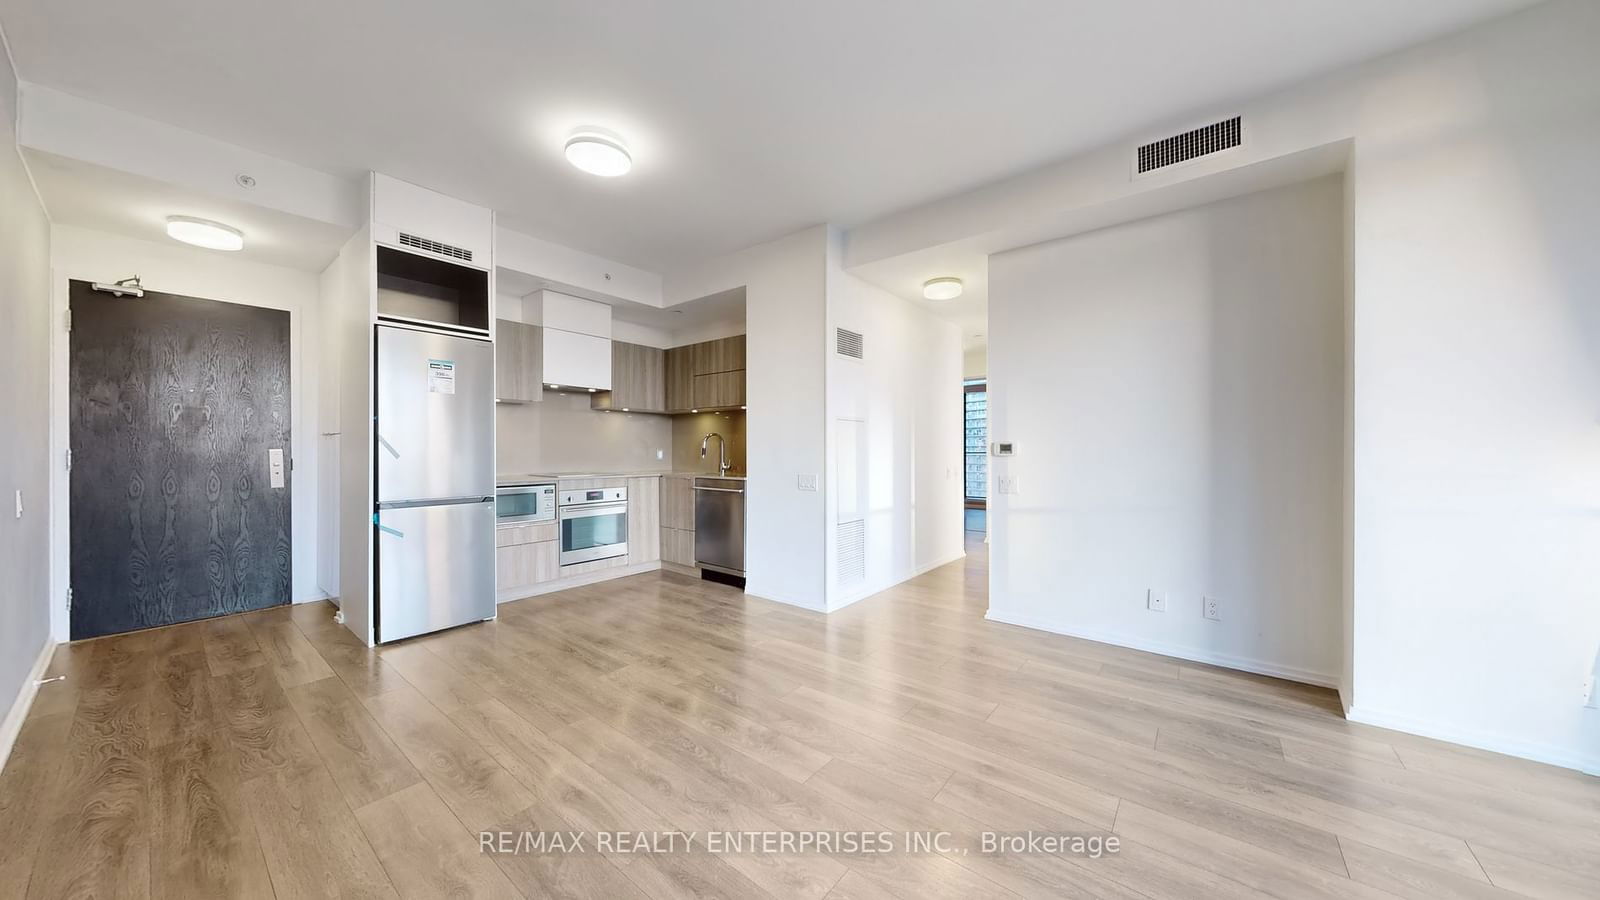
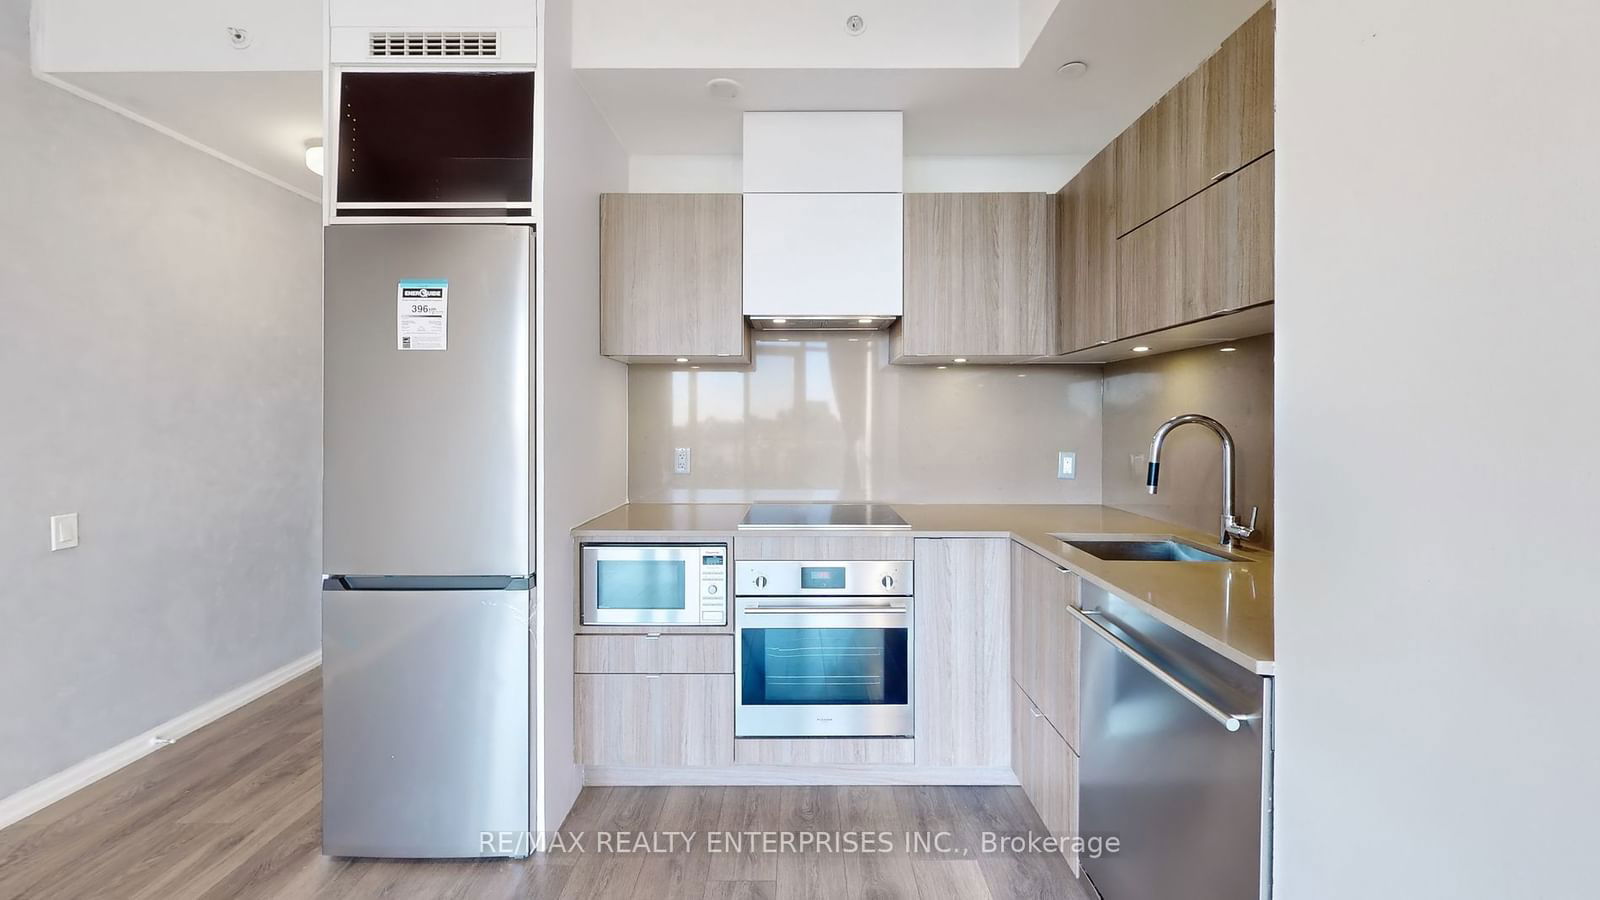
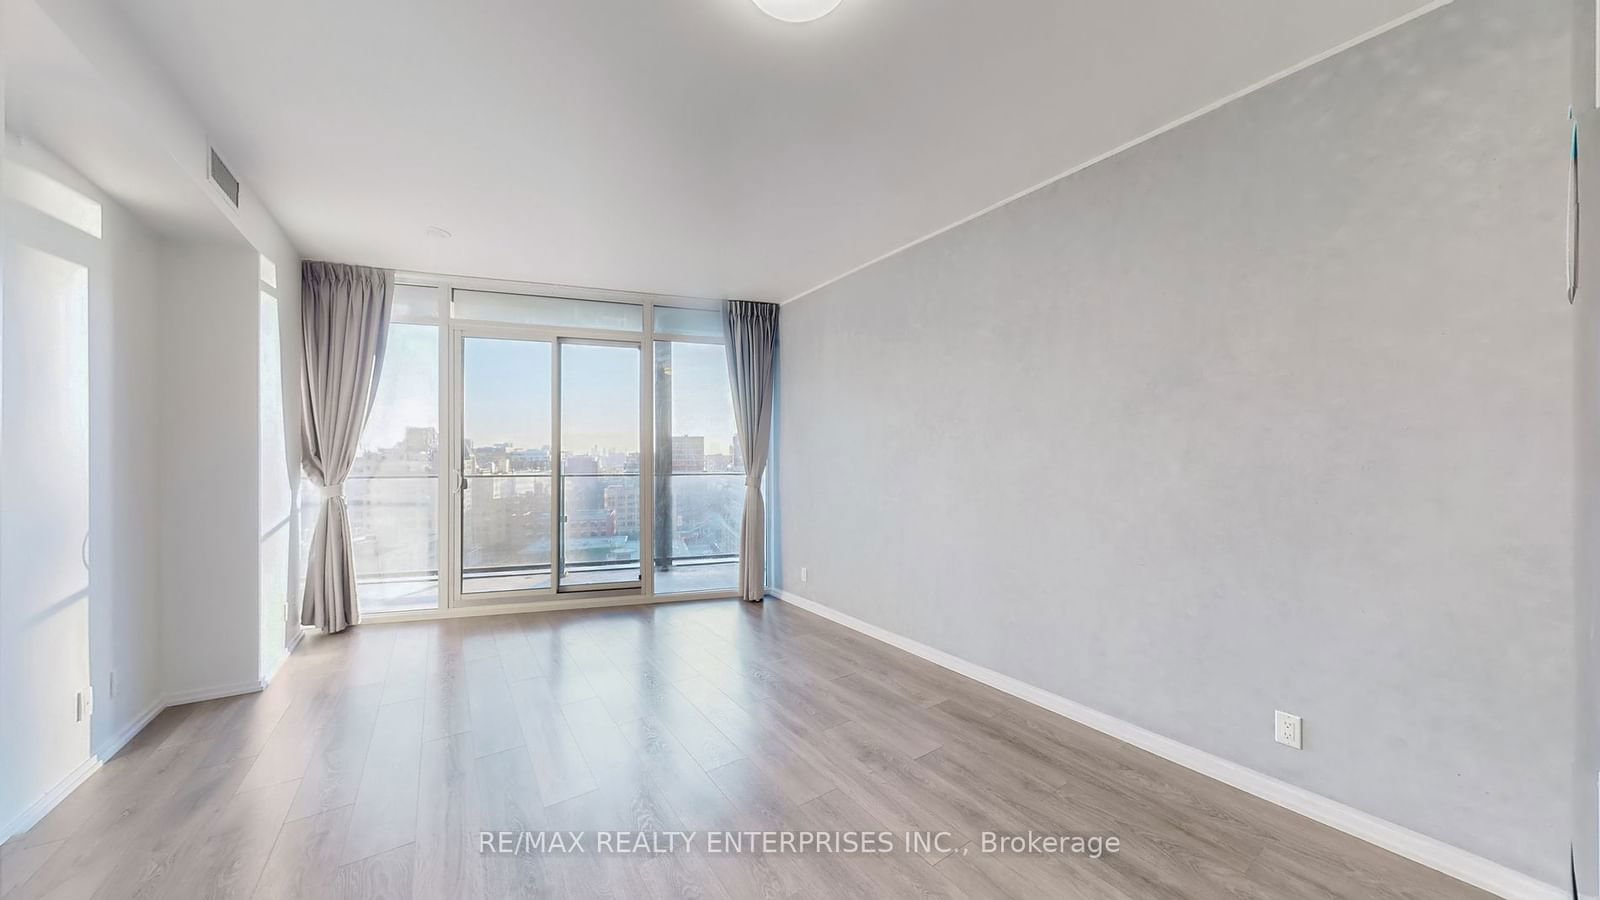
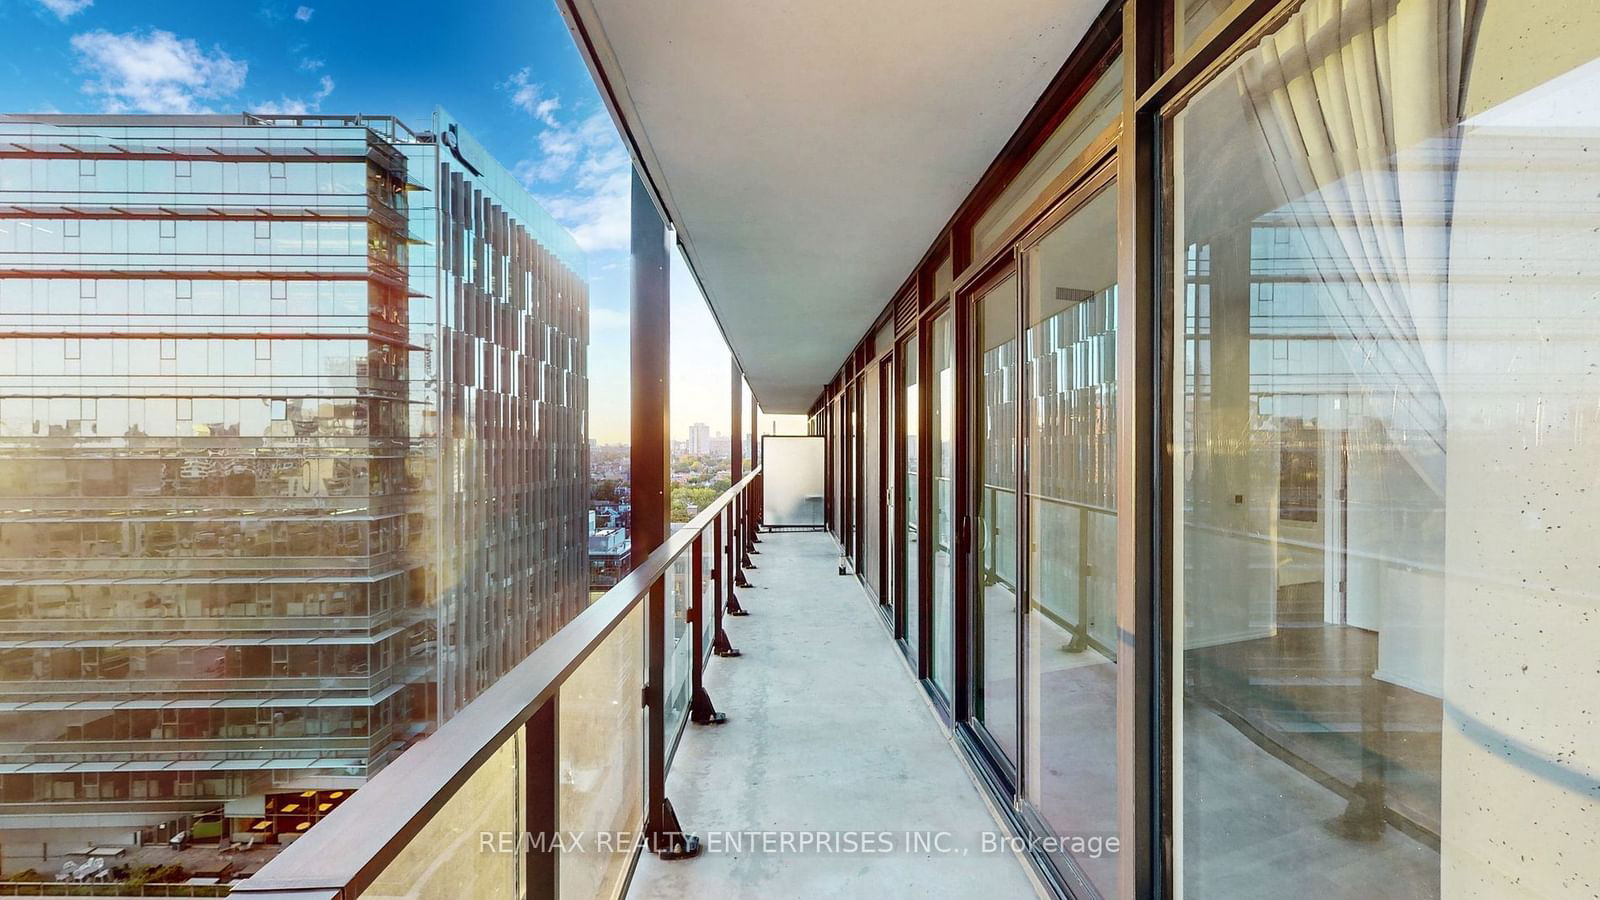
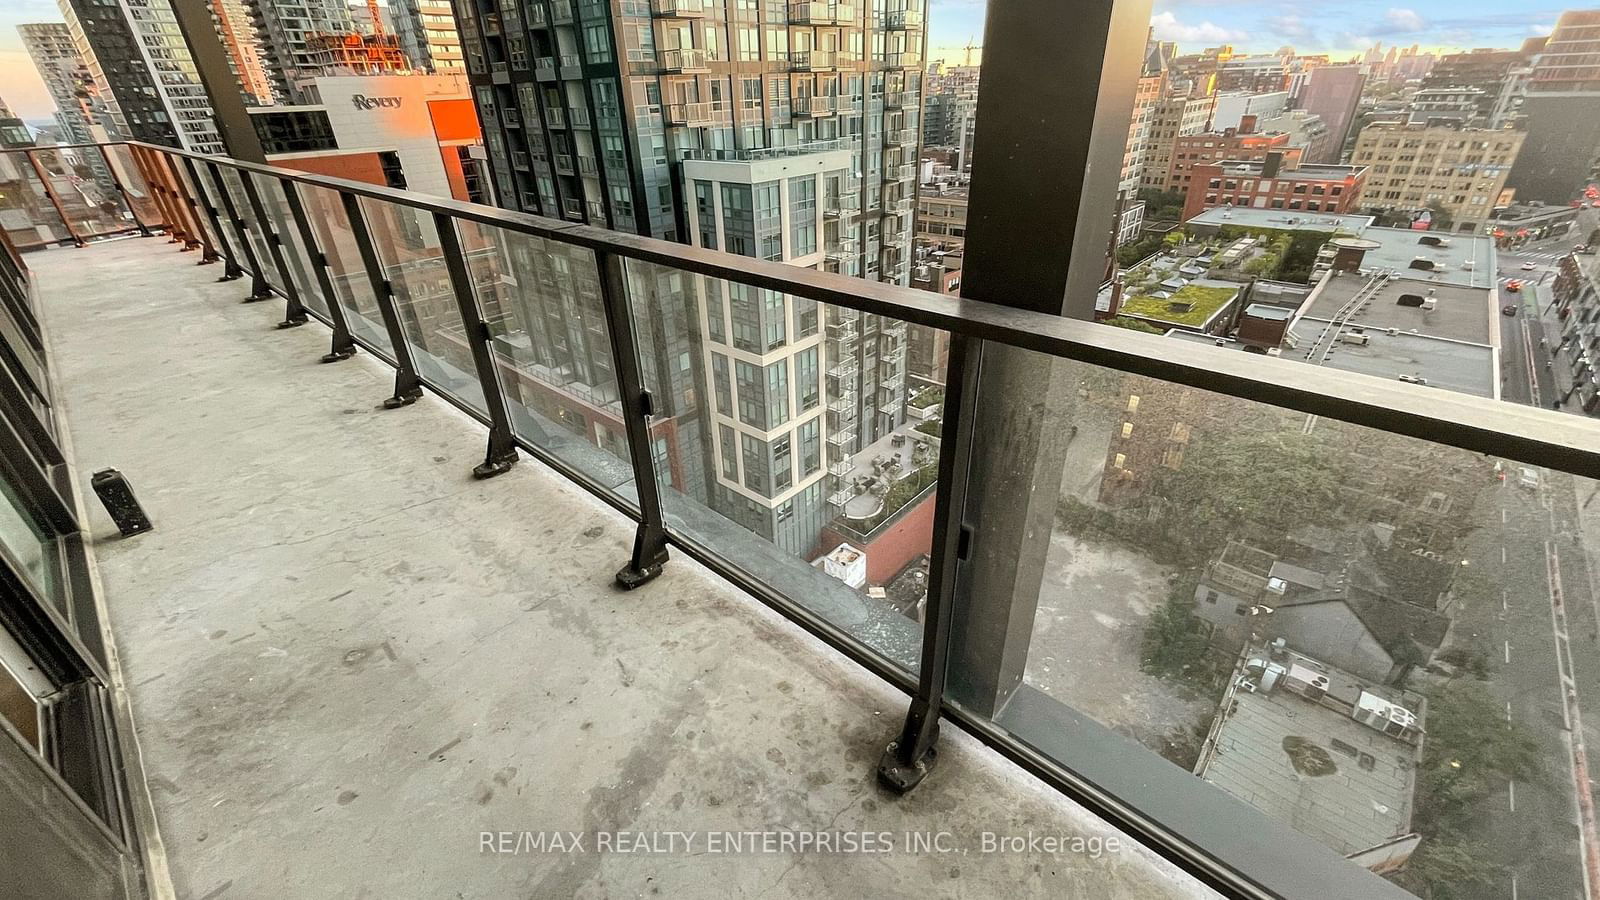
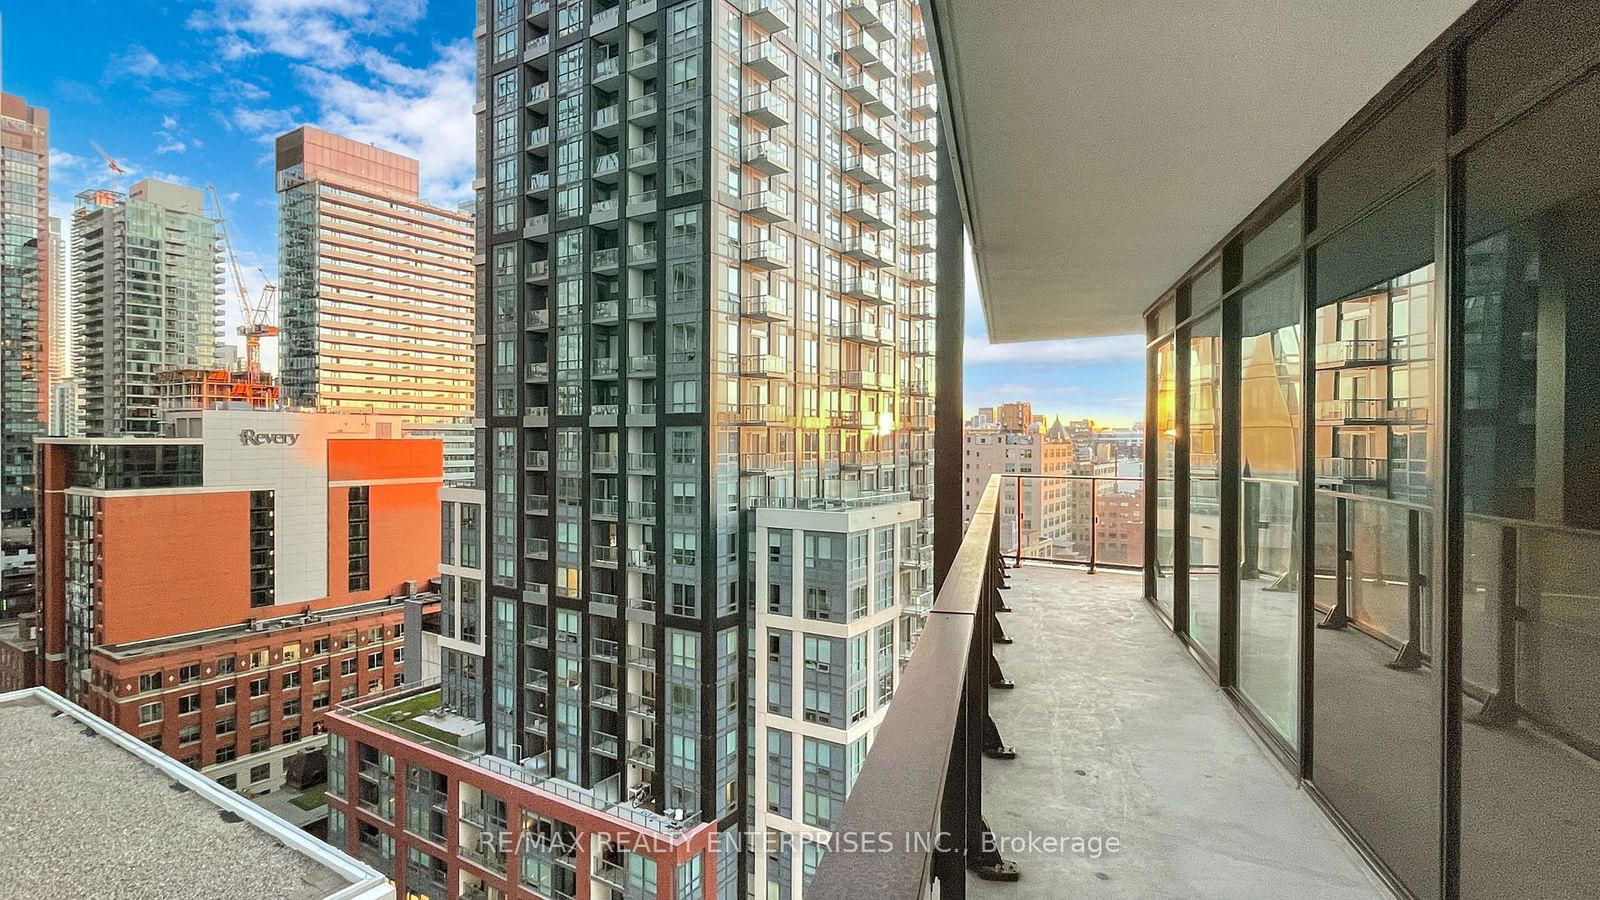
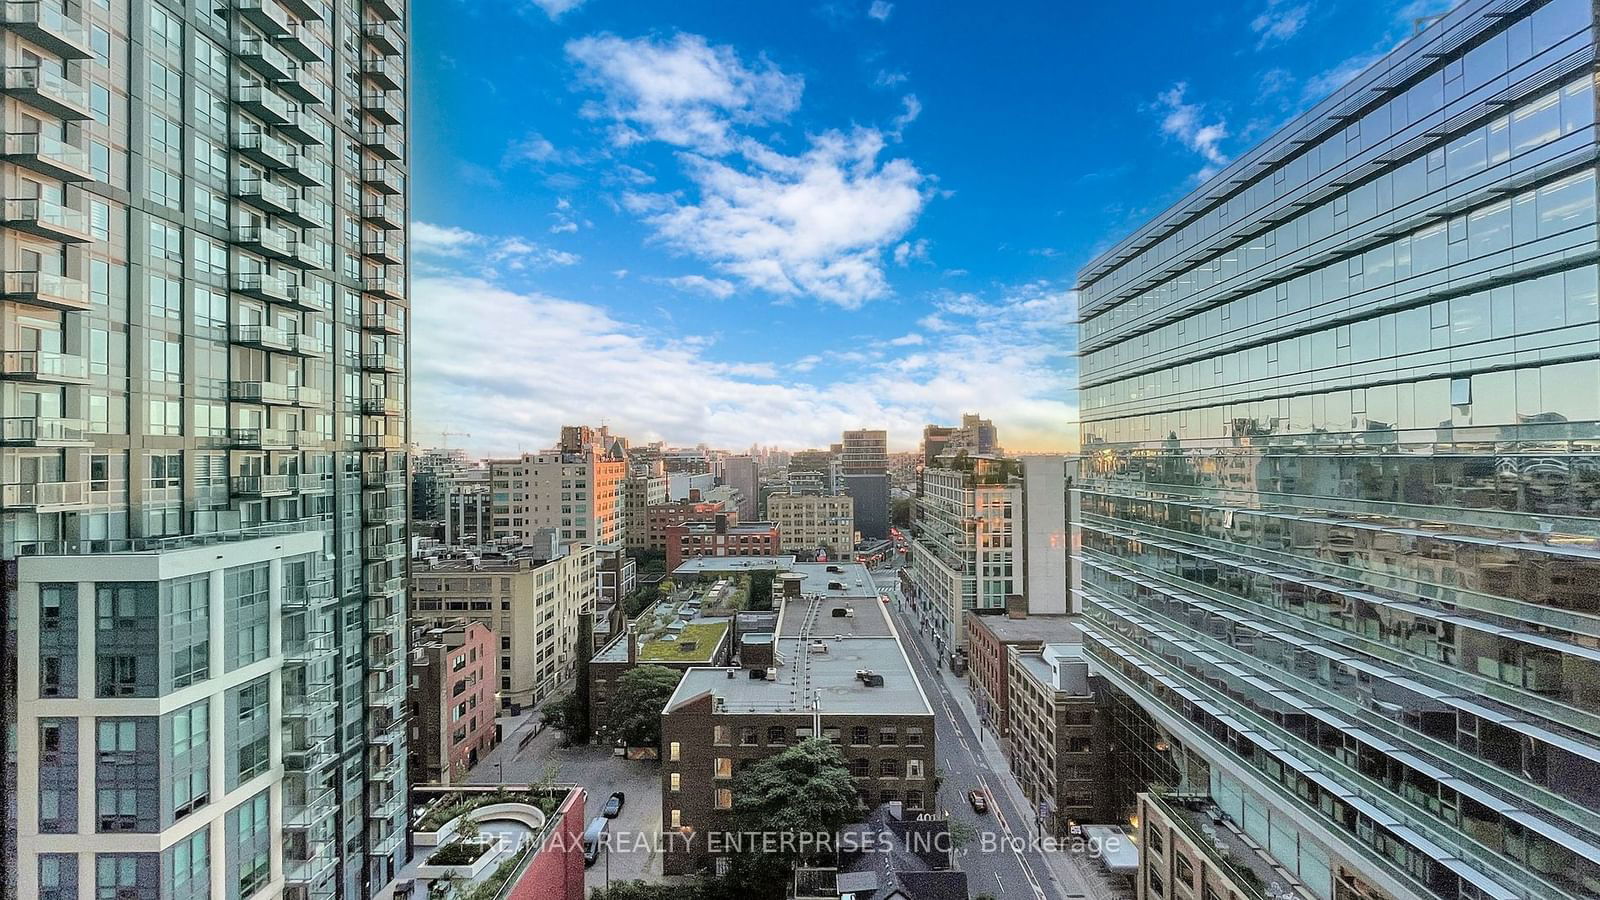
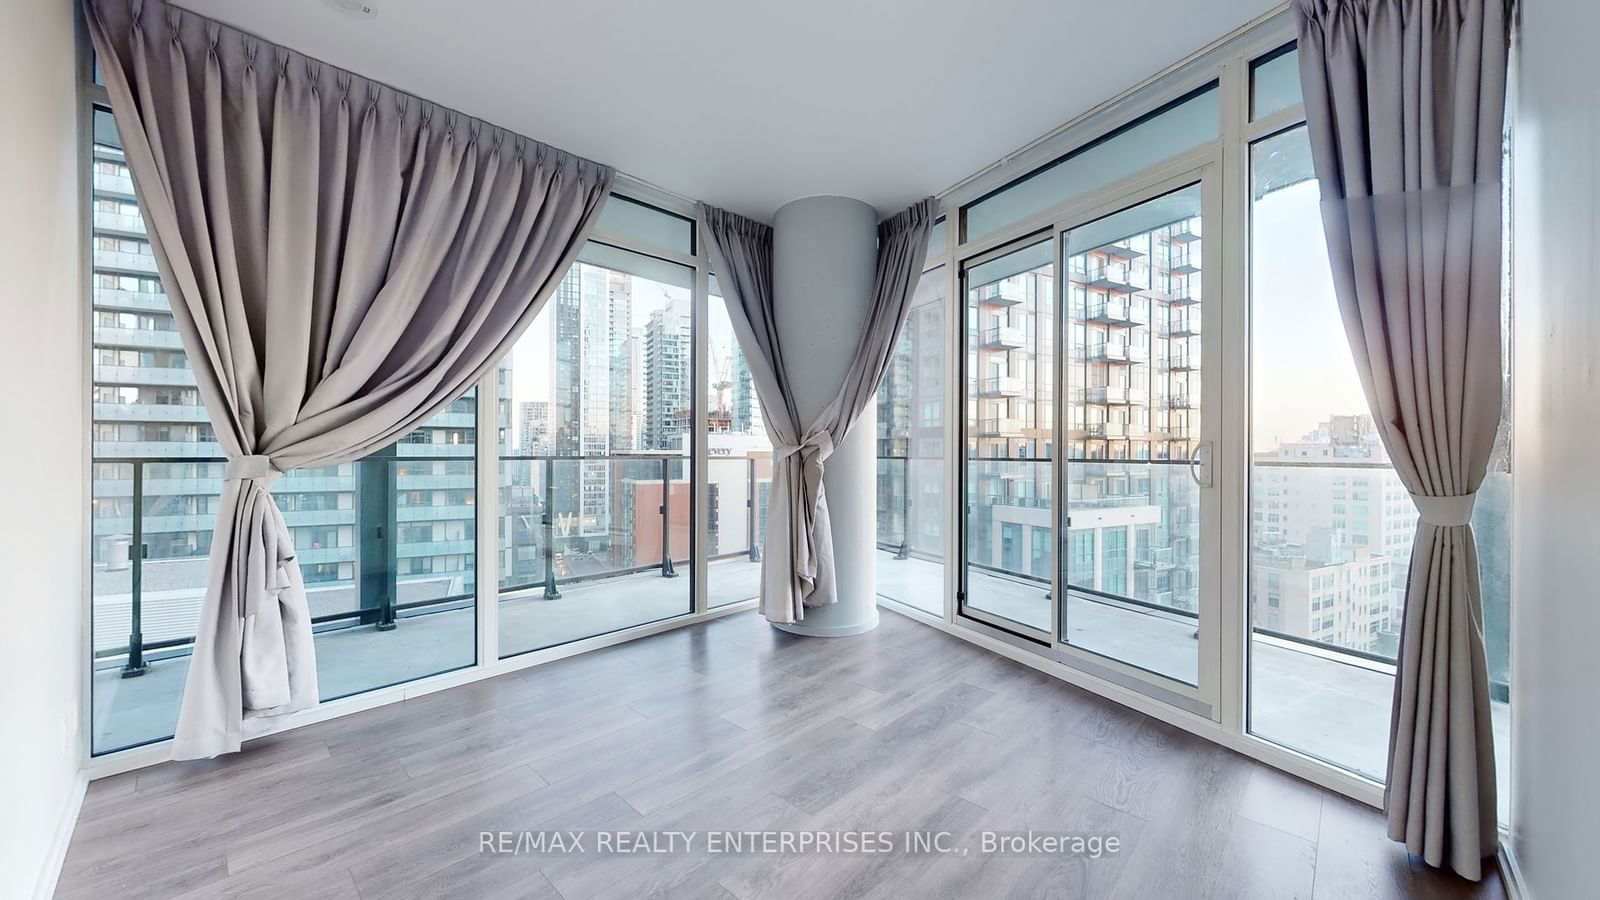
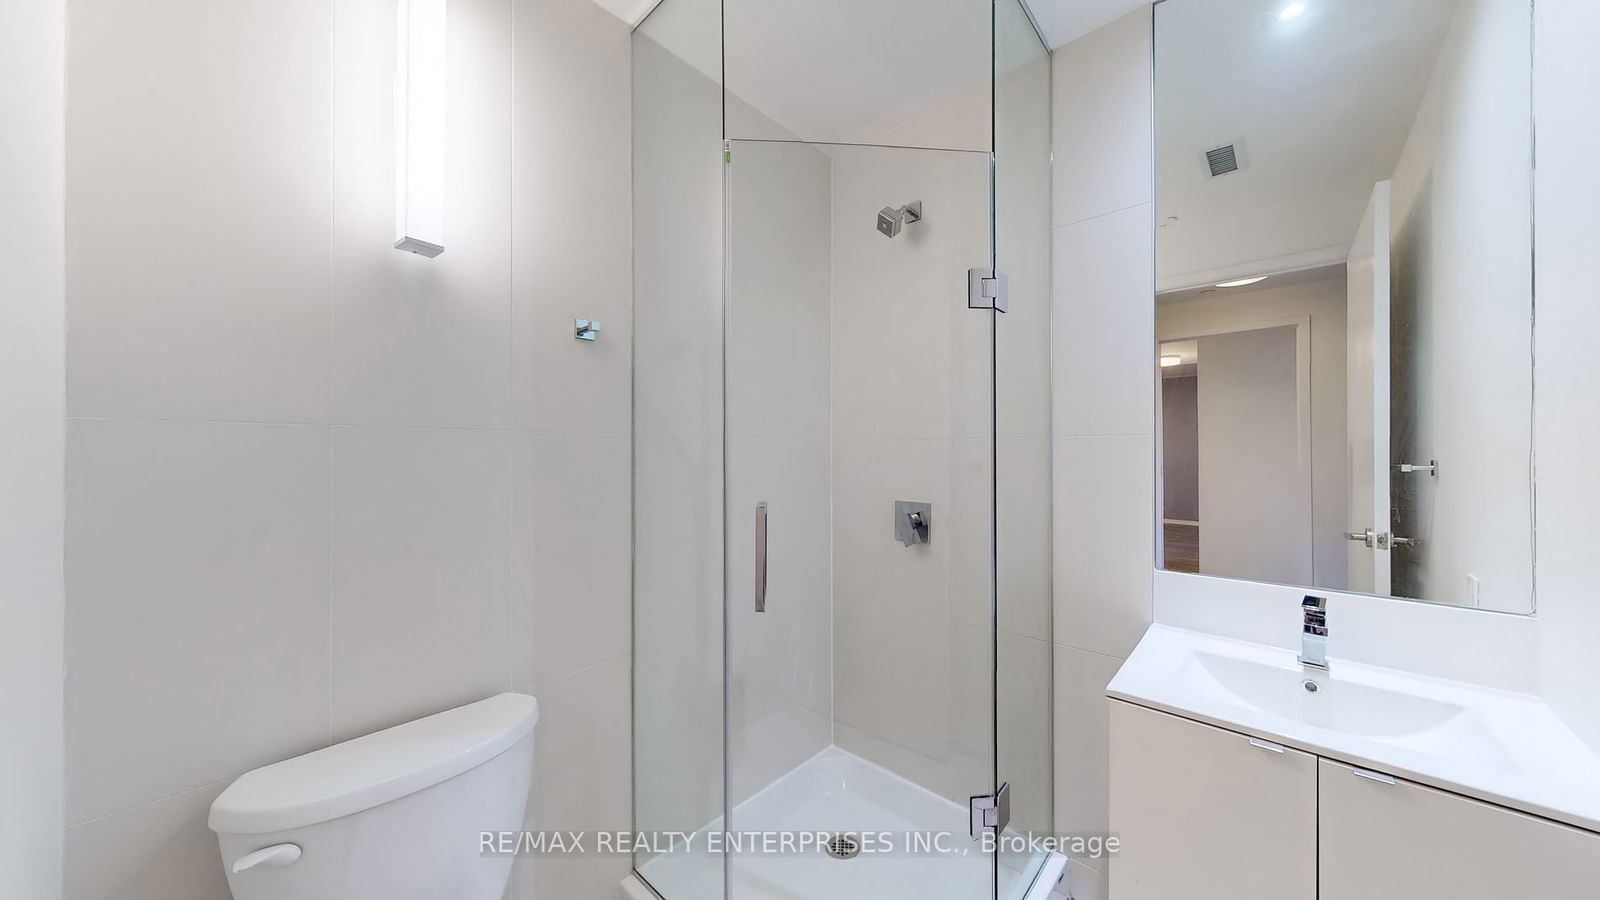
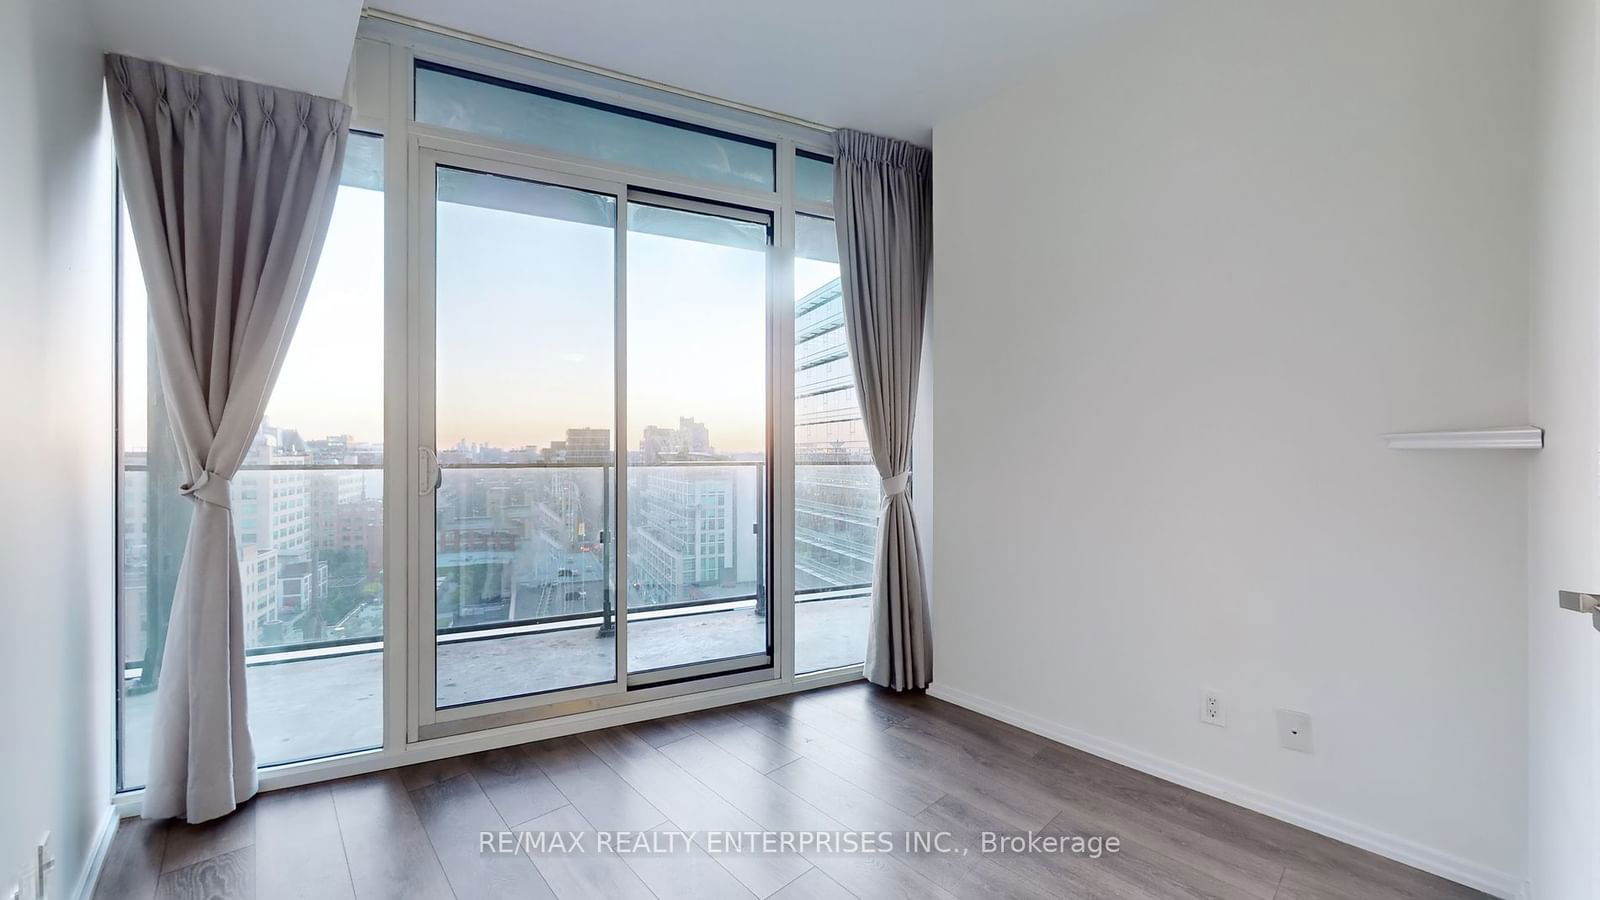
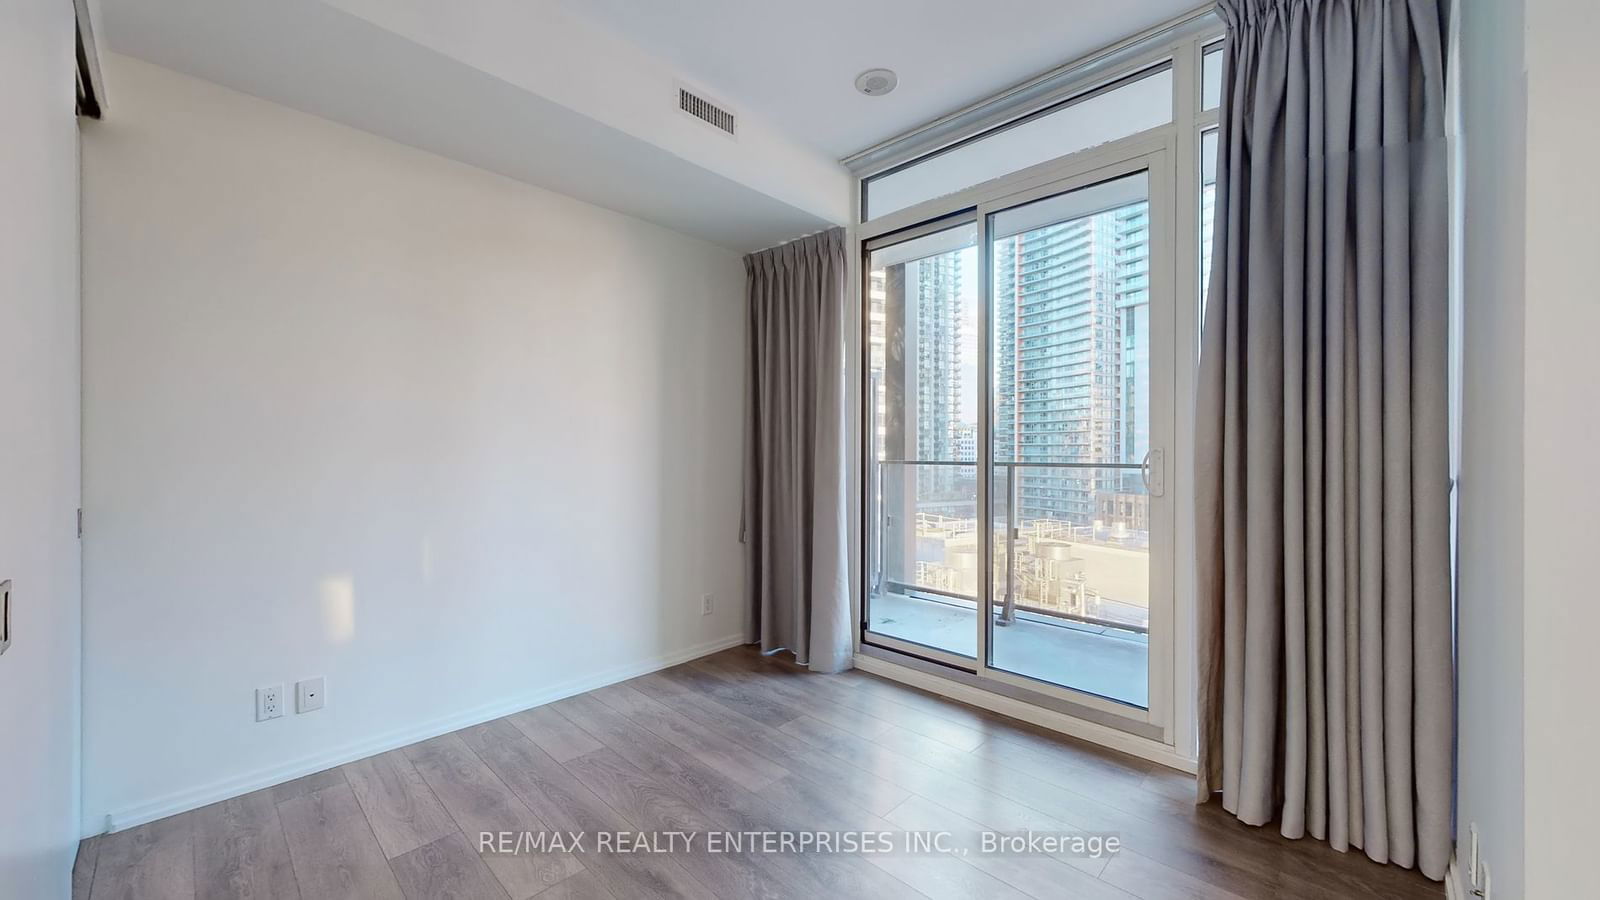
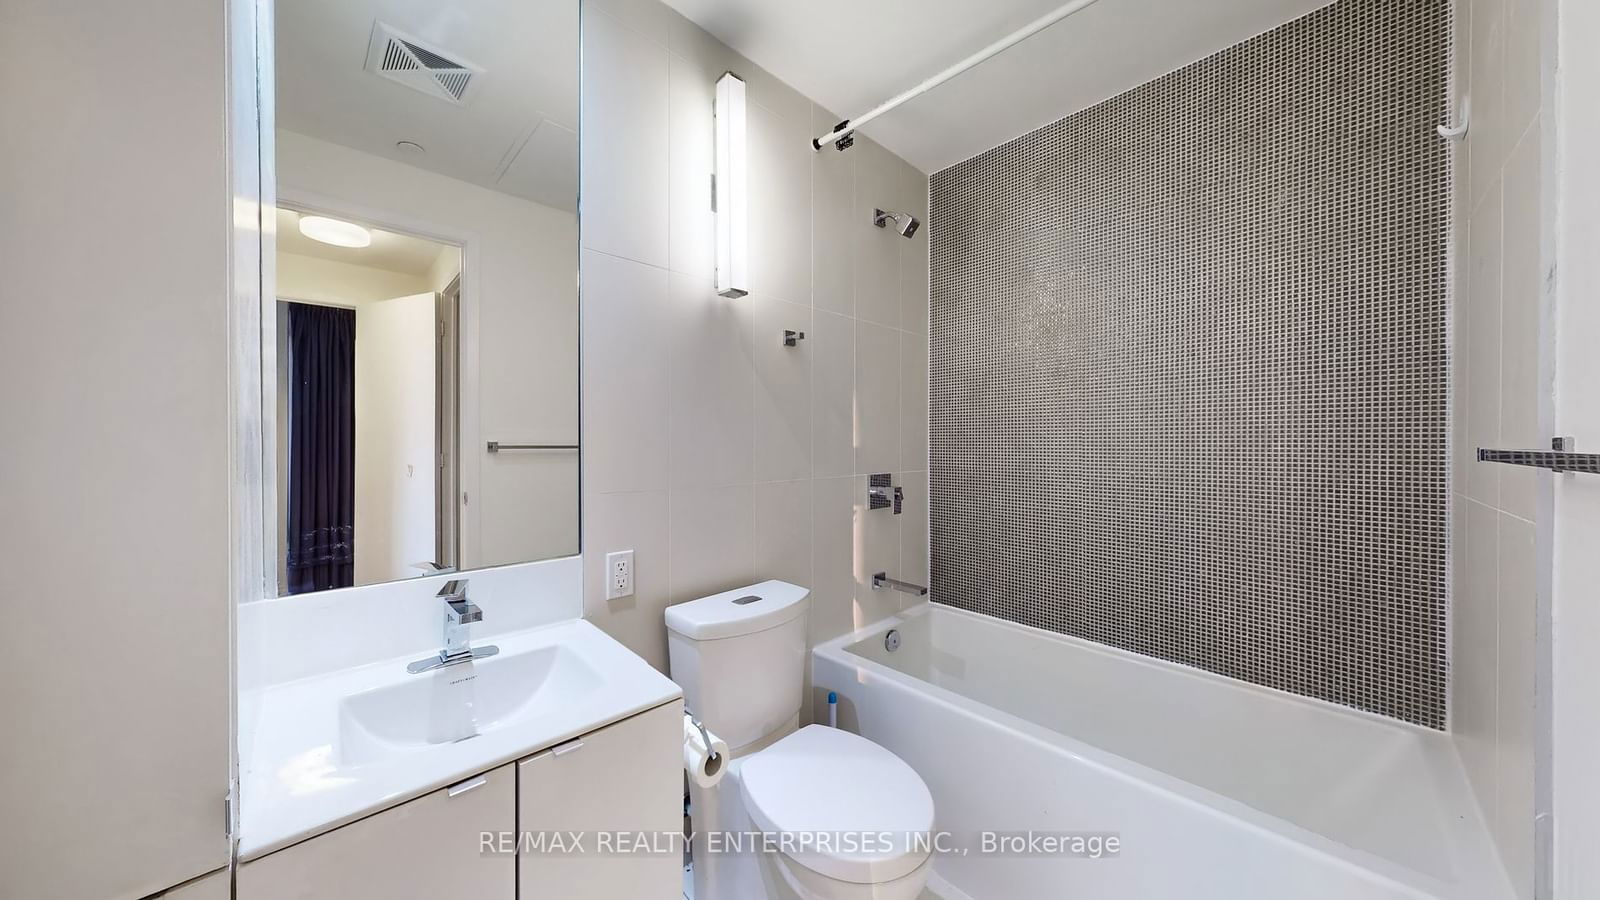
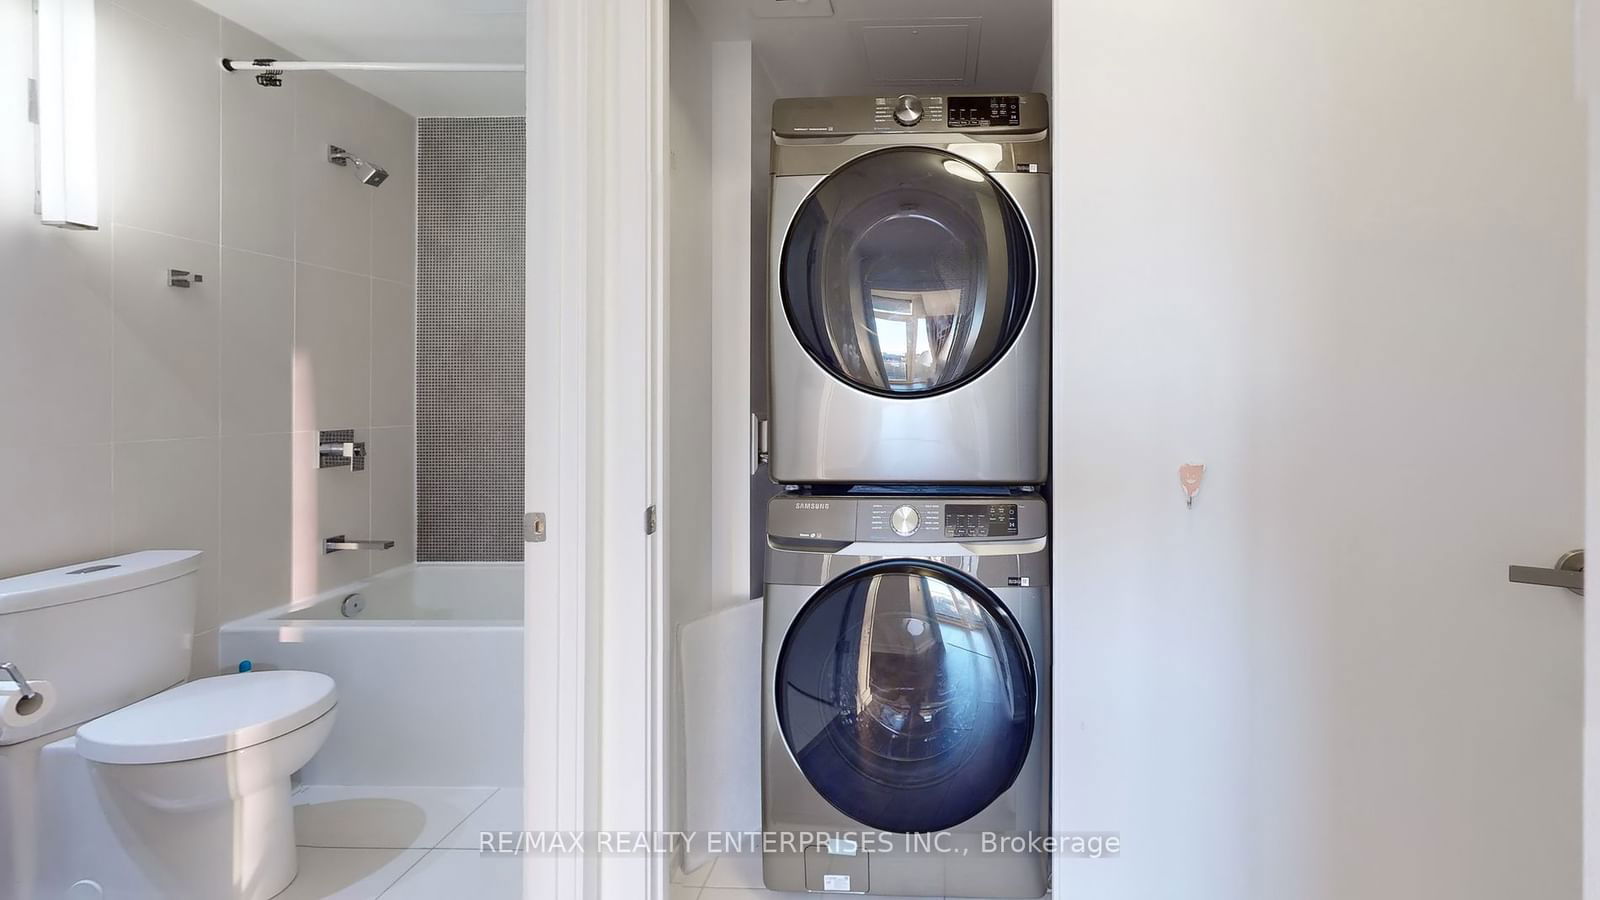
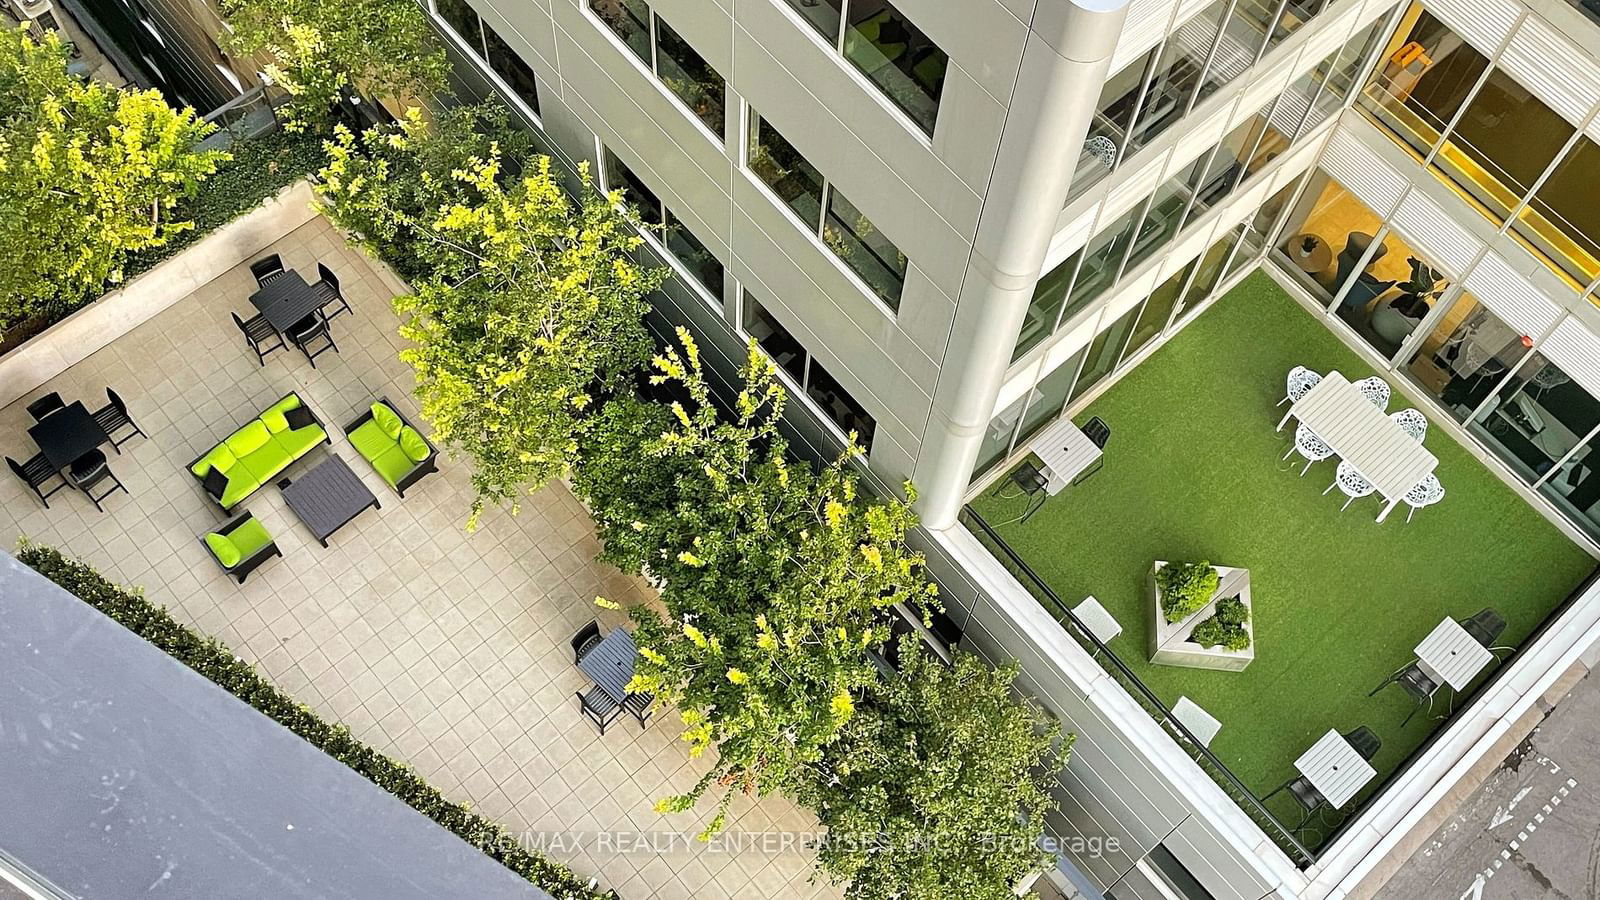
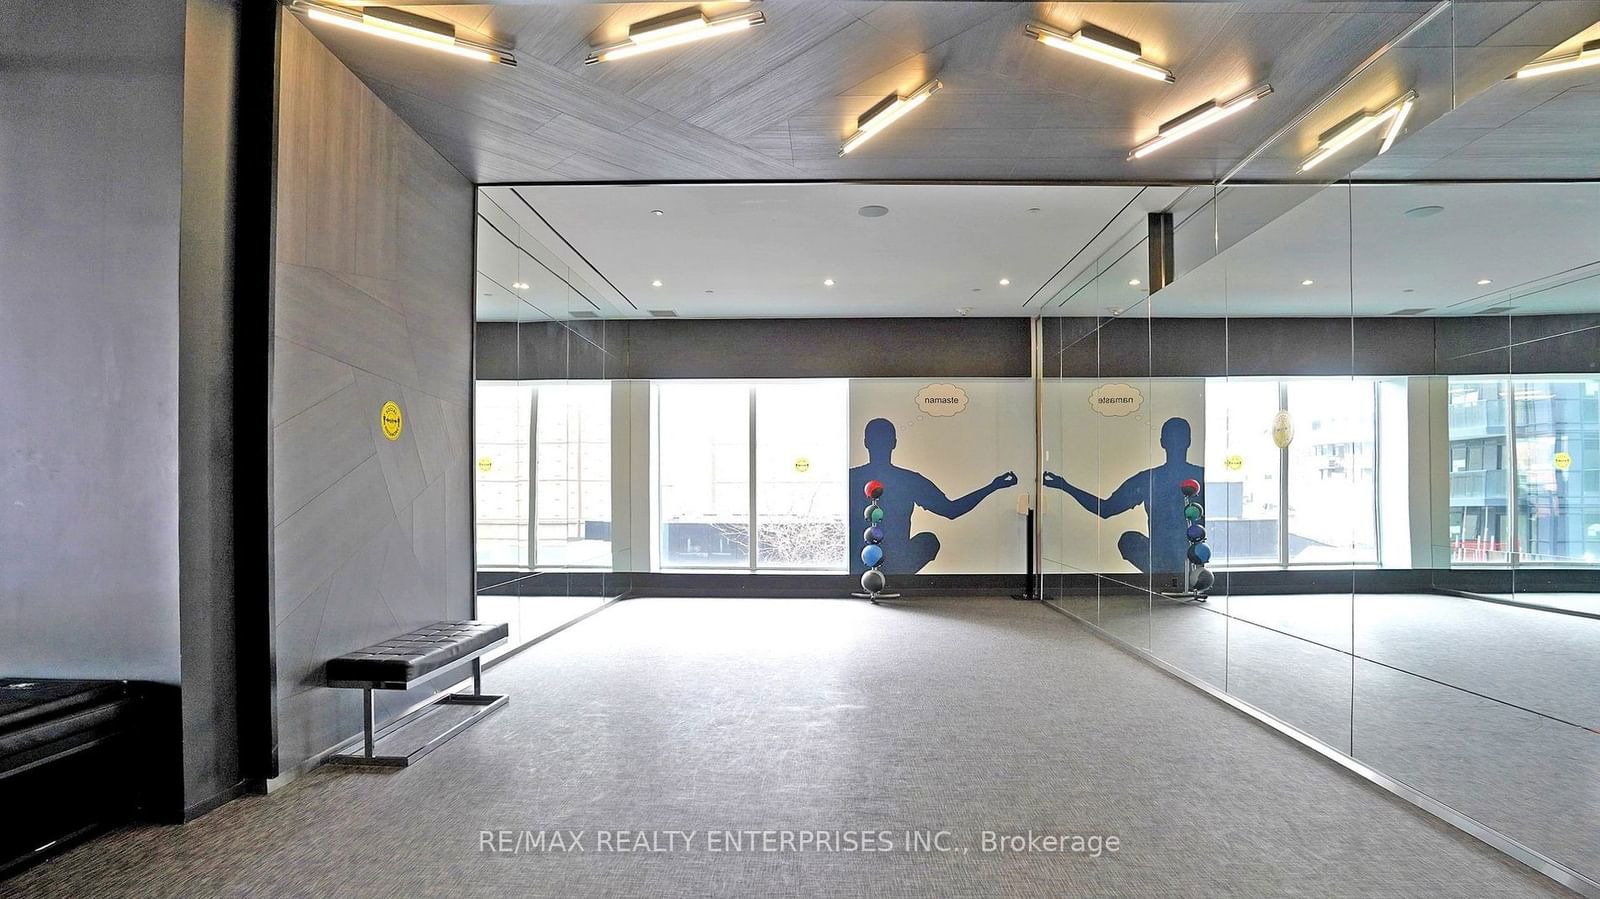
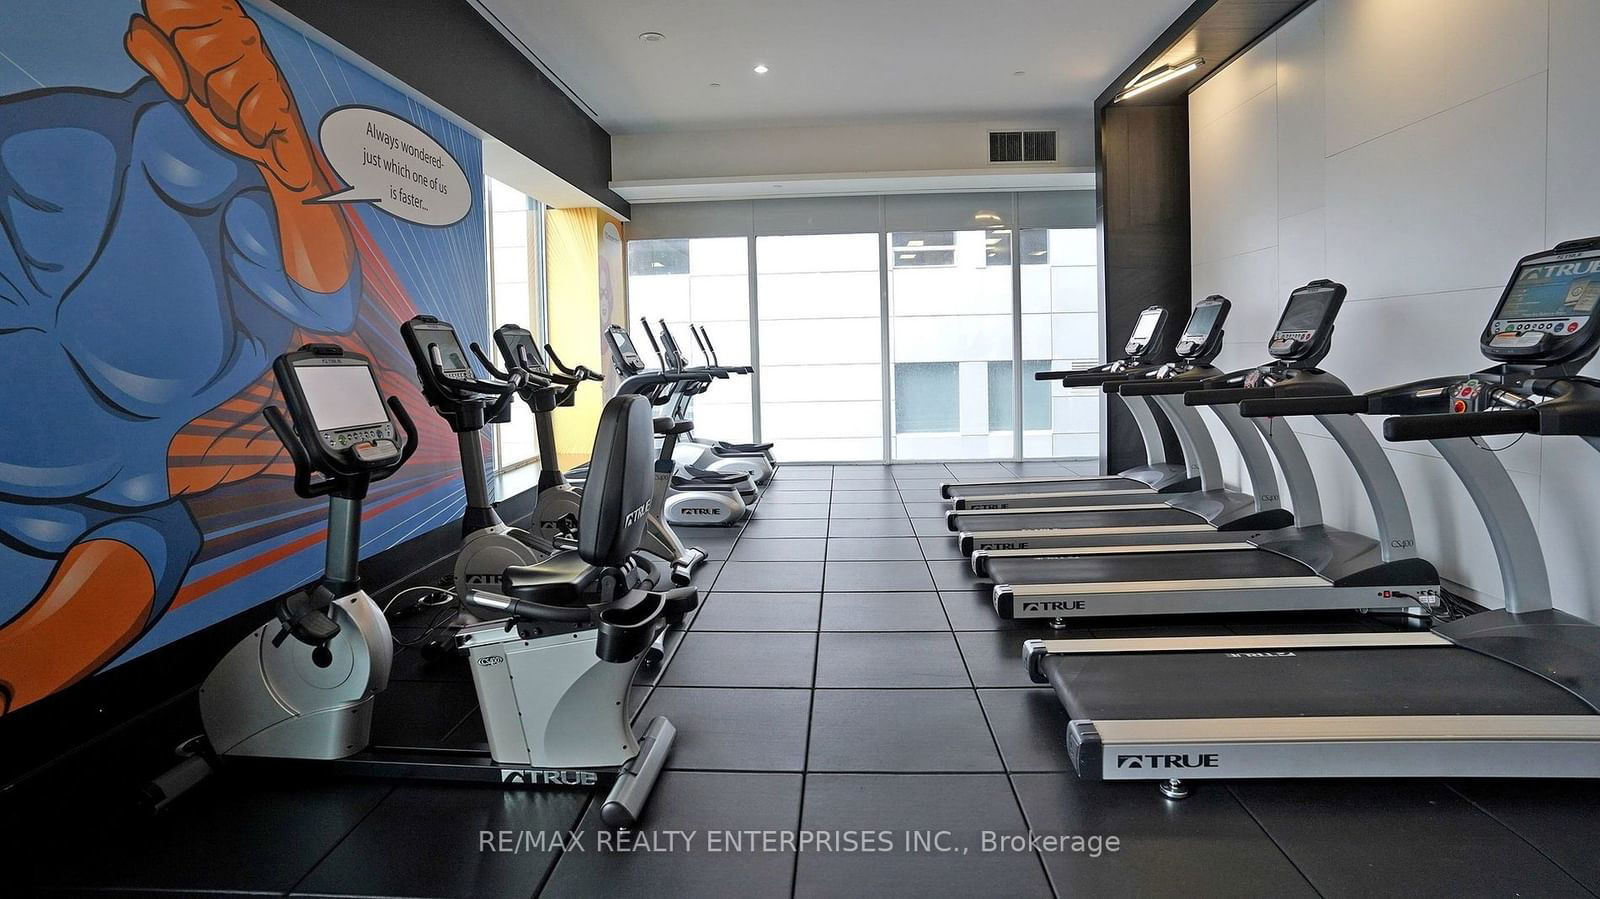
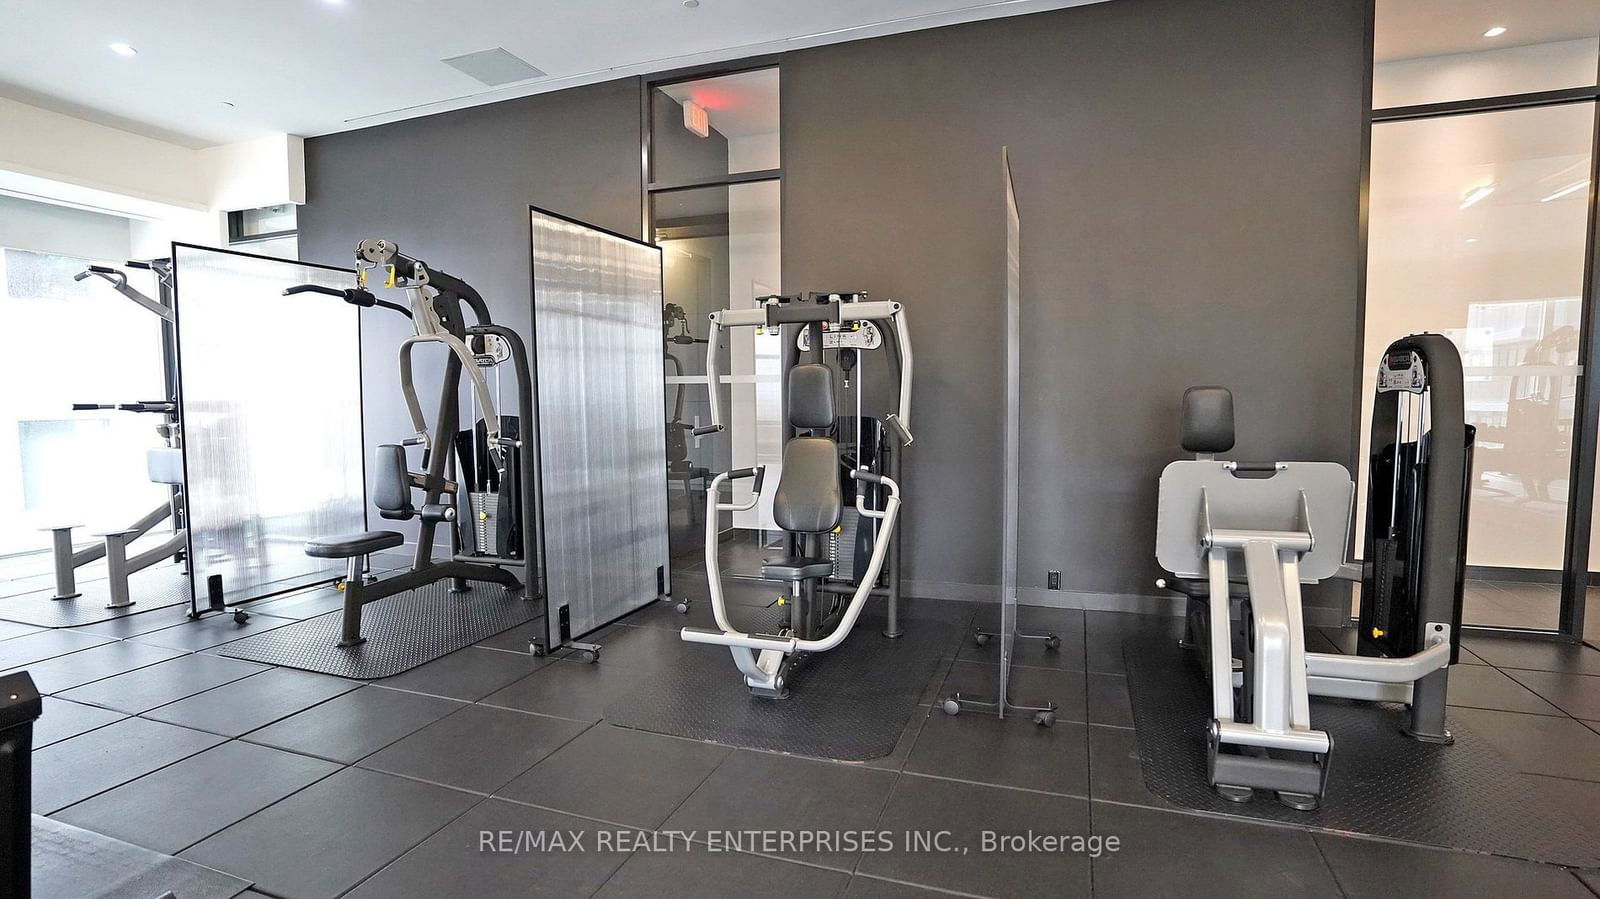
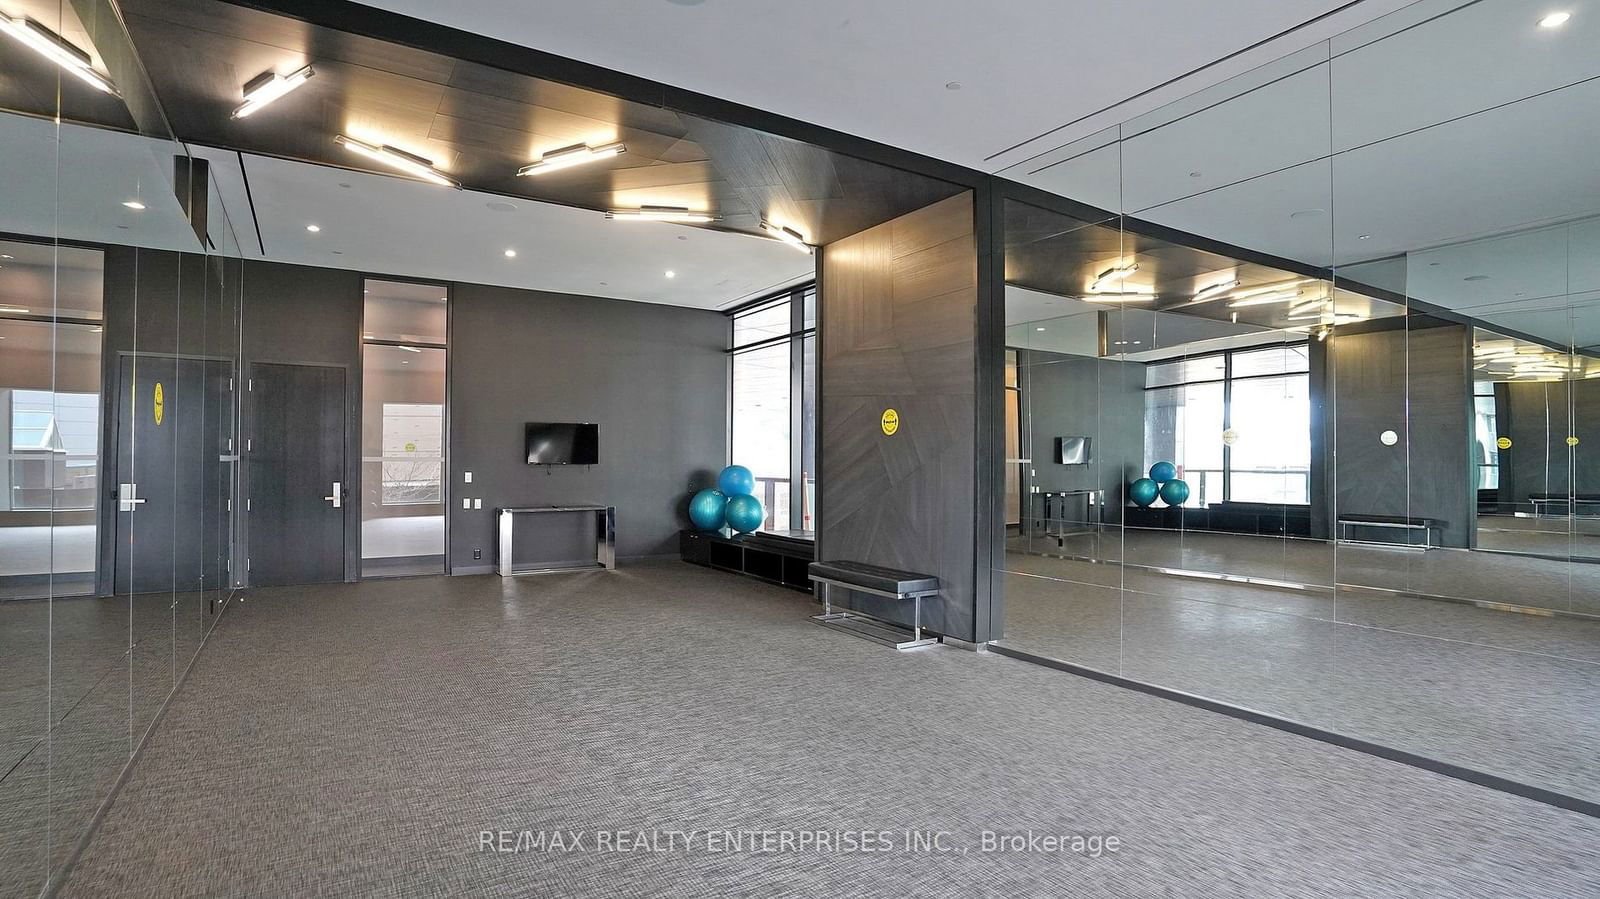
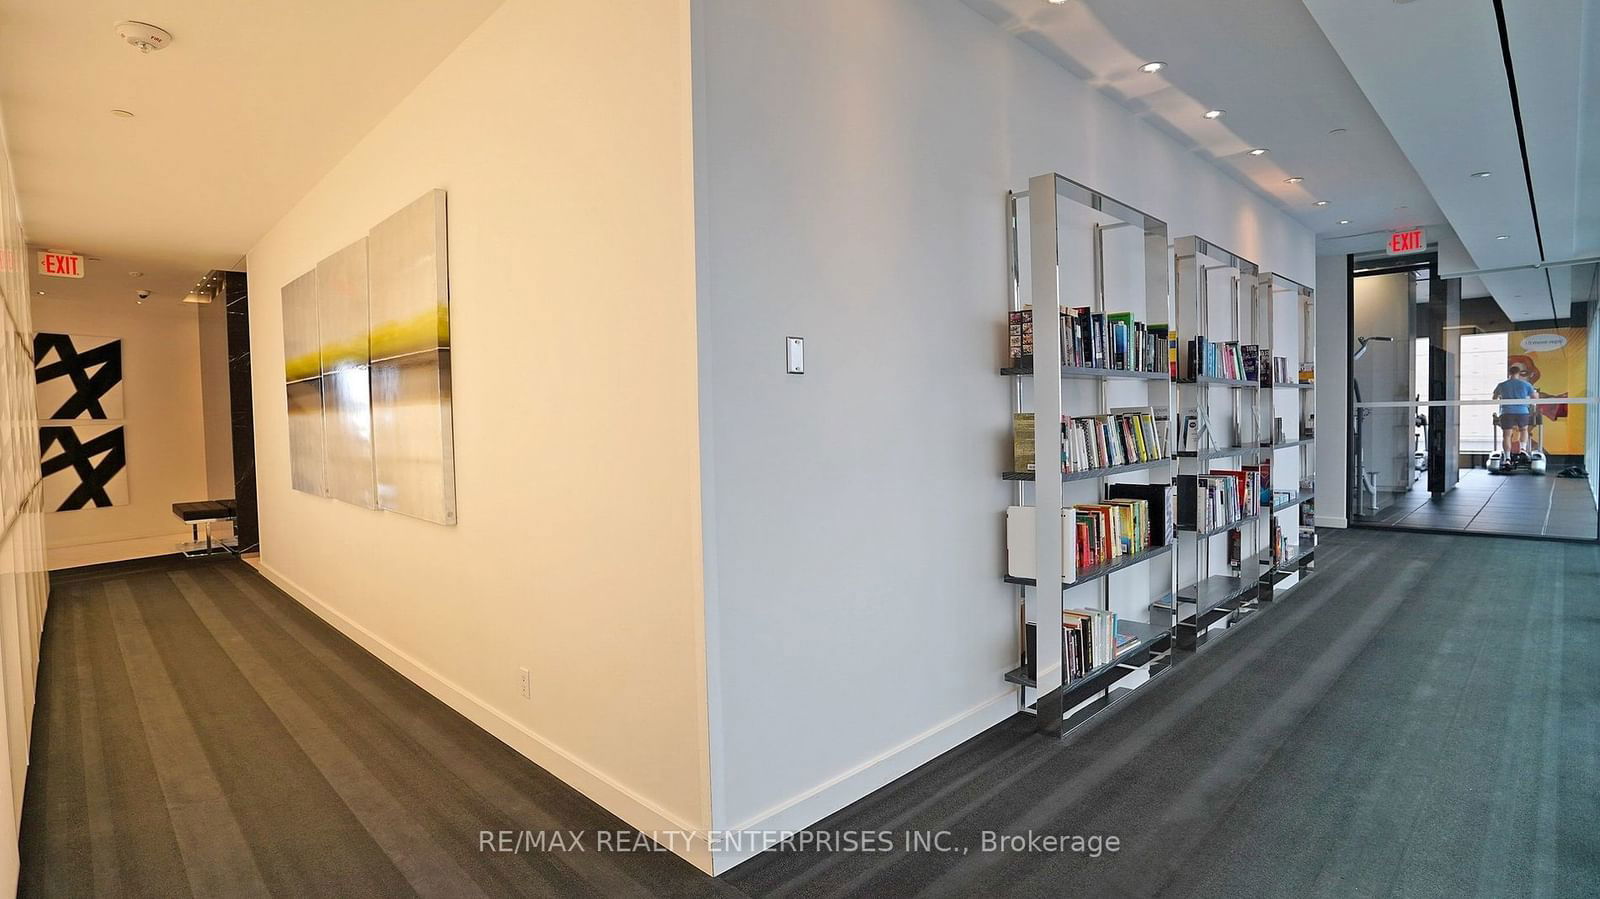
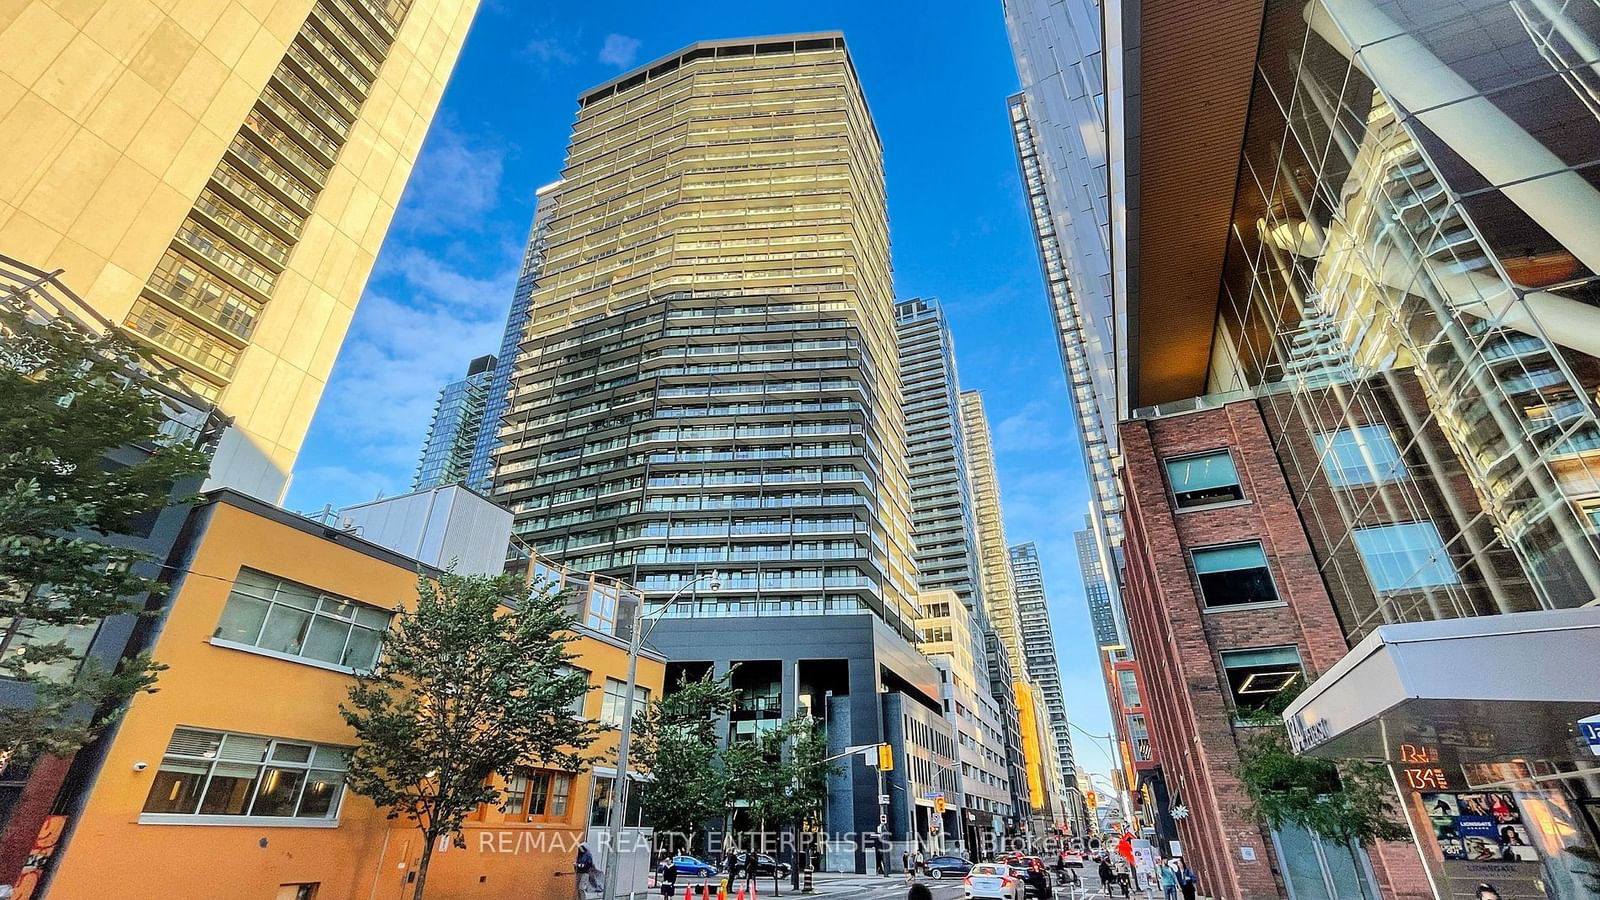
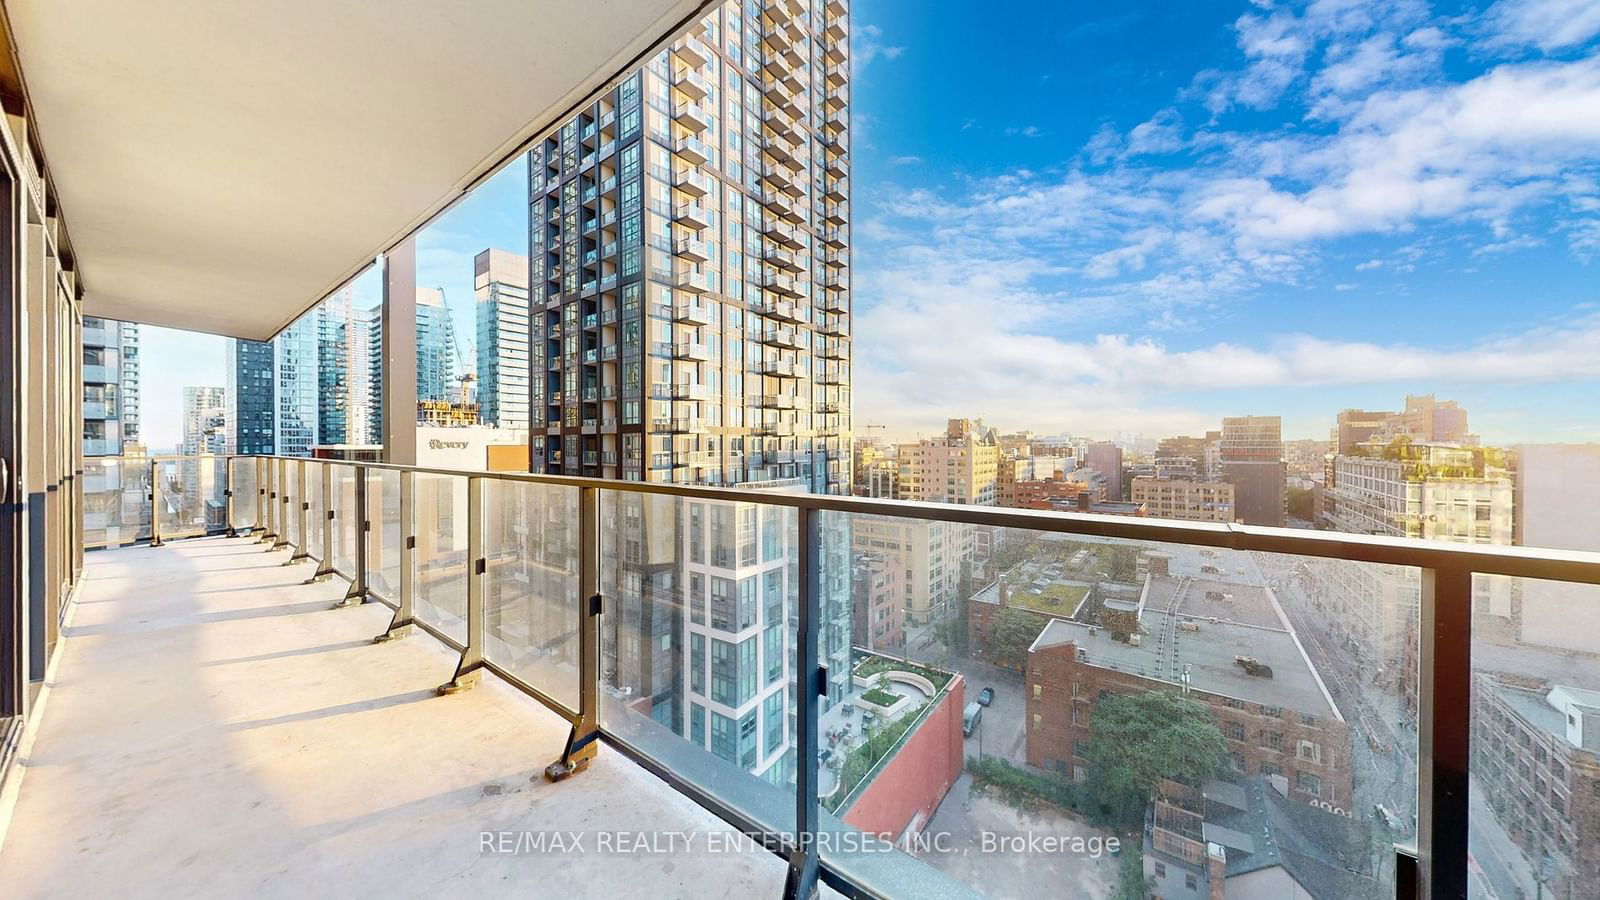
Rare 3 bedroom 2 bath condo with huge terrace and high floor panoramic views in downtown Toronto Queen West area! Each bedroom has a walkout to the 365 sq ft wrap around terrace! Entertainment District steps to Financial and Fashion District. Walking distance to U of T & TMU (Ryerson), OCAD universities, hospitals, shopping, dining, sports and entertainment venues and much more! Owned locker and underground parking, although you can leave thecar parked at this location! 100 walk score, 100 transit score, 98 bike score! Steps to King, Queen or Spadina street car, easy access to subway and highways. Building has Guest suites, terrace with cabanas and bbqs, gym and yoga rooms, party room, theatre and media rooms. Plenty of storage in closet and pantry. New fridge and laundry 2024.
re/max realty enterprises inc.MLS® #C9297432
Amenities
Explore Neighbourhood
Similar Listings
Demographics
Based on the dissemination area as defined by Statistics Canada. A dissemination area contains, on average, approximately 200 – 400 households.
Price Trends
Maintenance Fees
Building Trends At Tableau Condominiums
Days on Strata
List vs Selling Price
Offer Competition
Turnover of Units
Property Value
Price Ranking
Sold Units
Rented Units
Best Value Rank
Appreciation Rank
Rental Yield
High Demand
Transaction Insights at 125 Peter Street
| Studio | 1 Bed | 1 Bed + Den | 2 Bed | 3 Bed | 3 Bed + Den | |
|---|---|---|---|---|---|---|
| Price Range | No Data | No Data | $575,000 - $682,500 | $725,000 - $818,000 | No Data | No Data |
| Avg. Cost Per Sqft | No Data | No Data | $1,059 | $1,202 | No Data | No Data |
| Price Range | $2,000 - $2,250 | $2,075 - $2,450 | $2,400 - $3,100 | $2,700 - $3,600 | $3,700 - $4,600 | No Data |
| Avg. Wait for Unit Availability | 381 Days | 82 Days | 30 Days | 49 Days | 157 Days | No Data |
| Avg. Wait for Unit Availability | 61 Days | 21 Days | 10 Days | 19 Days | 55 Days | No Data |
| Ratio of Units in Building | 7% | 19% | 42% | 24% | 10% | 1% |
Transactions vs Inventory
Total number of units listed and sold in Queen West
