3211 - 2191 Yonge St
Listing History
Unit Highlights
Maintenance Fees
Utility Type
- Air Conditioning
- Central Air
- Heat Source
- Gas
- Heating
- Forced Air
Room Dimensions
About this Listing
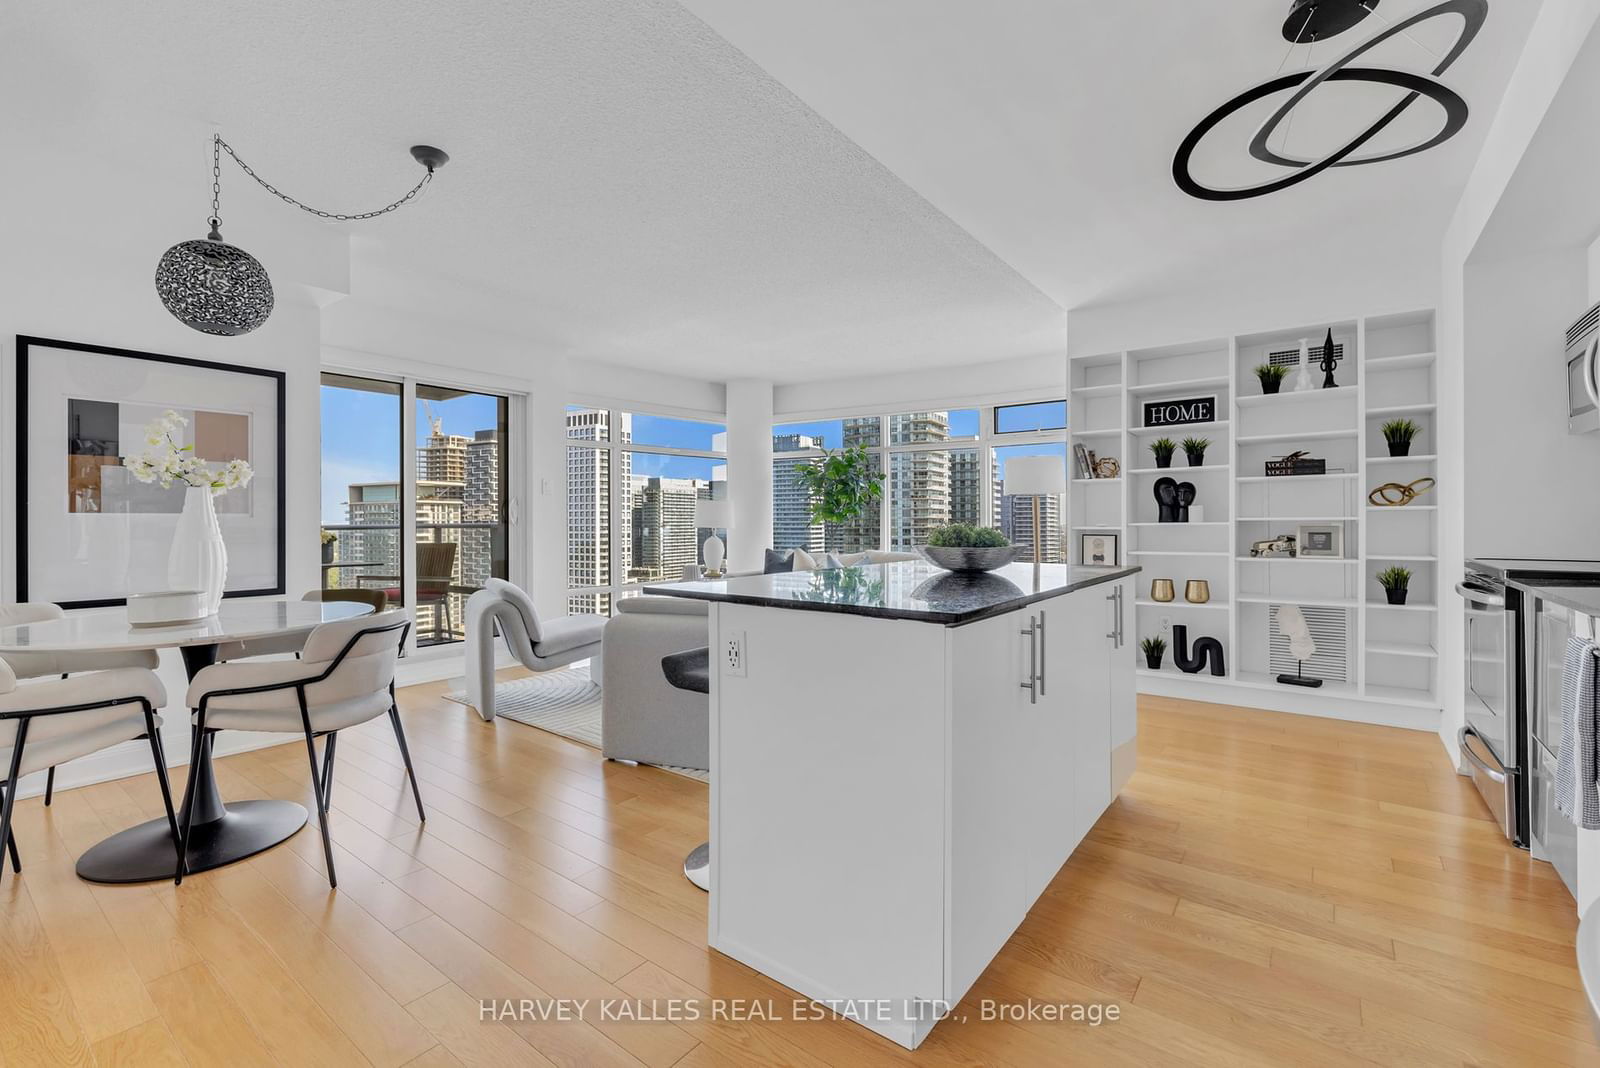
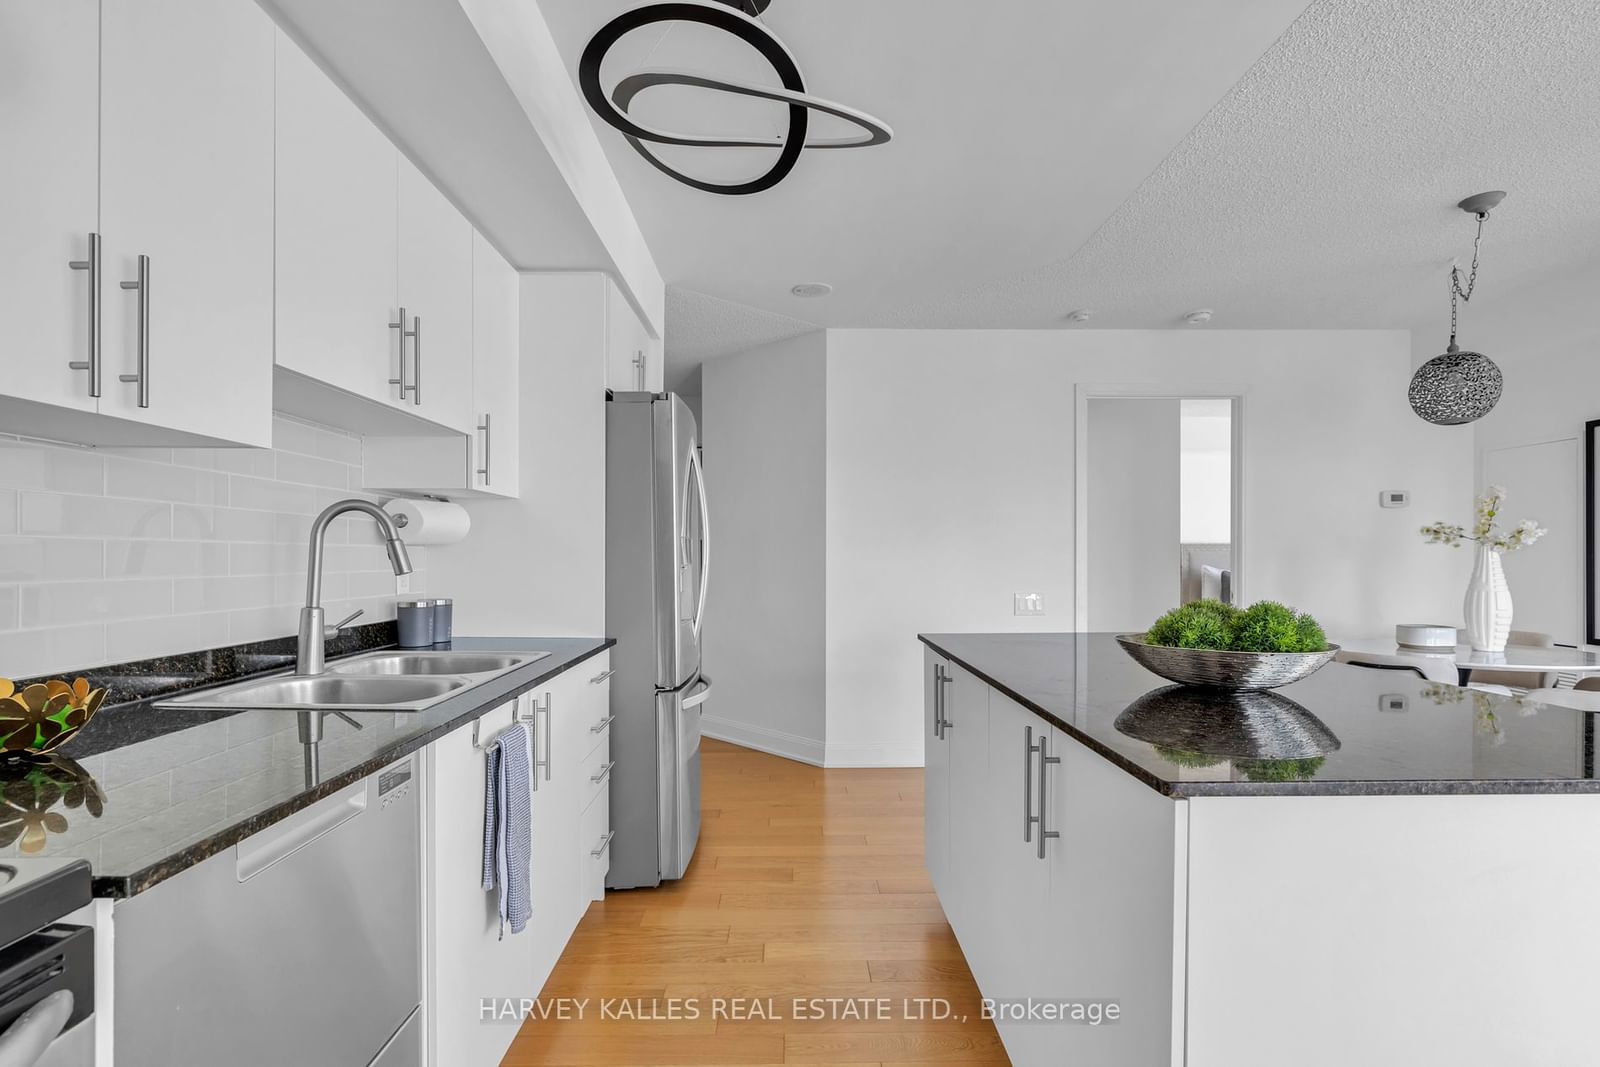
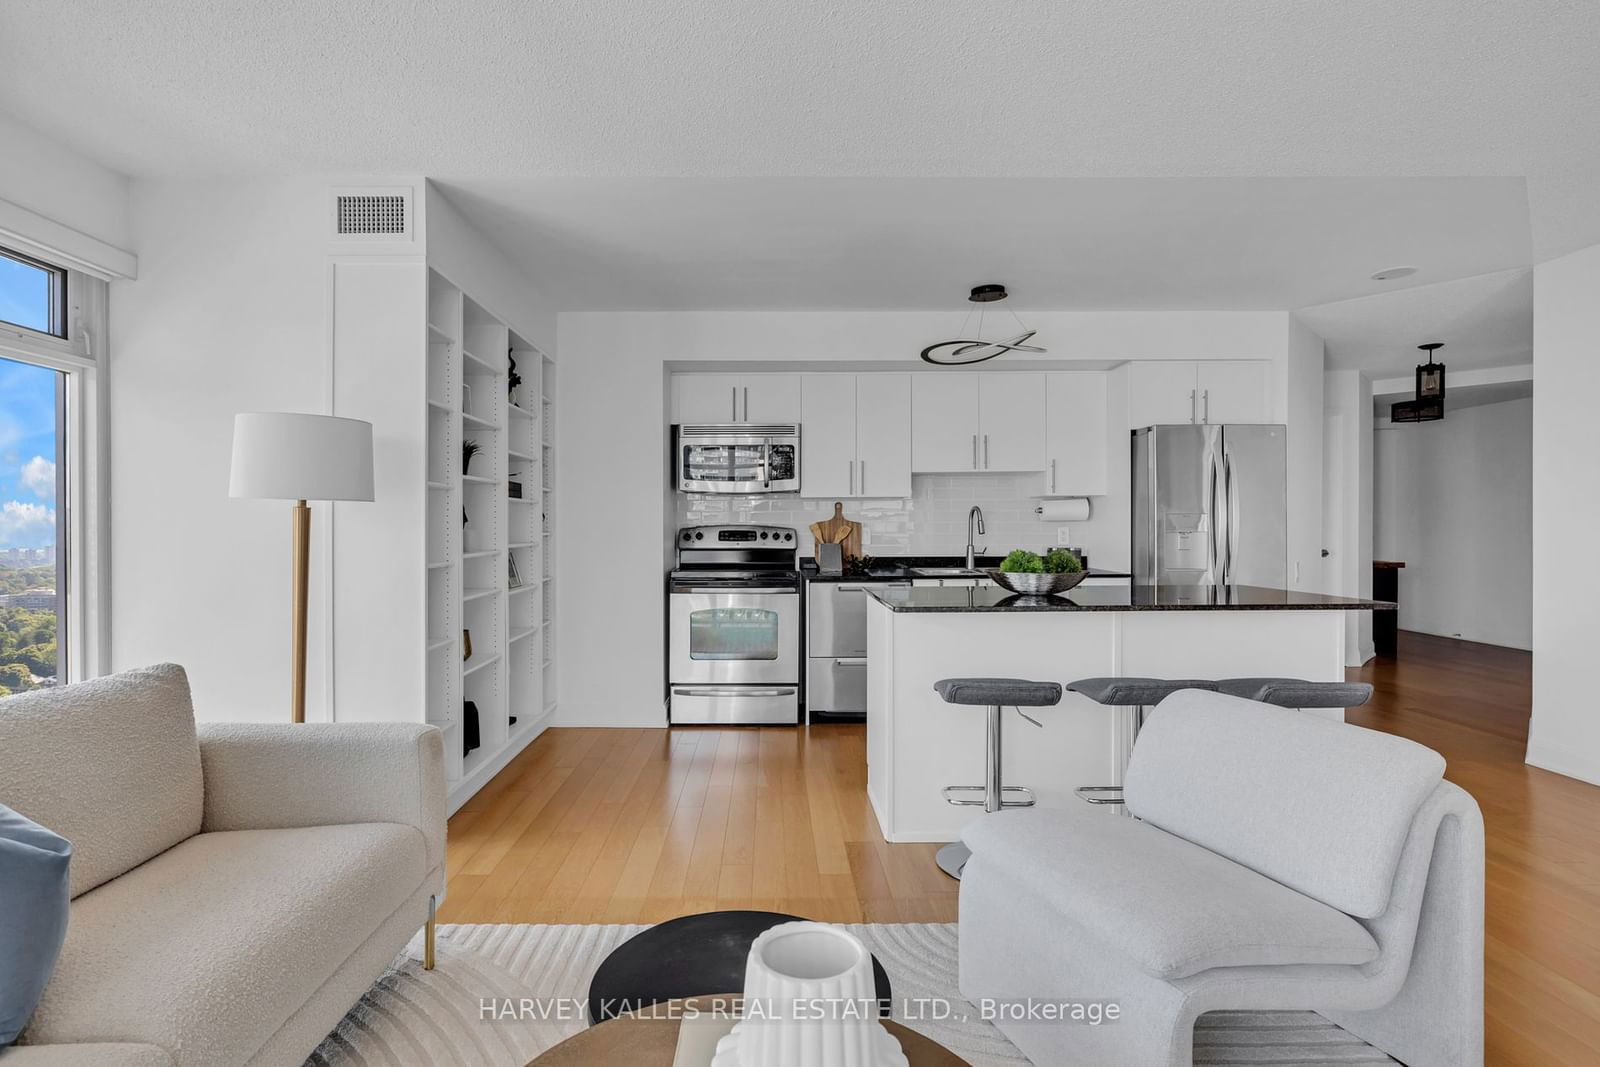
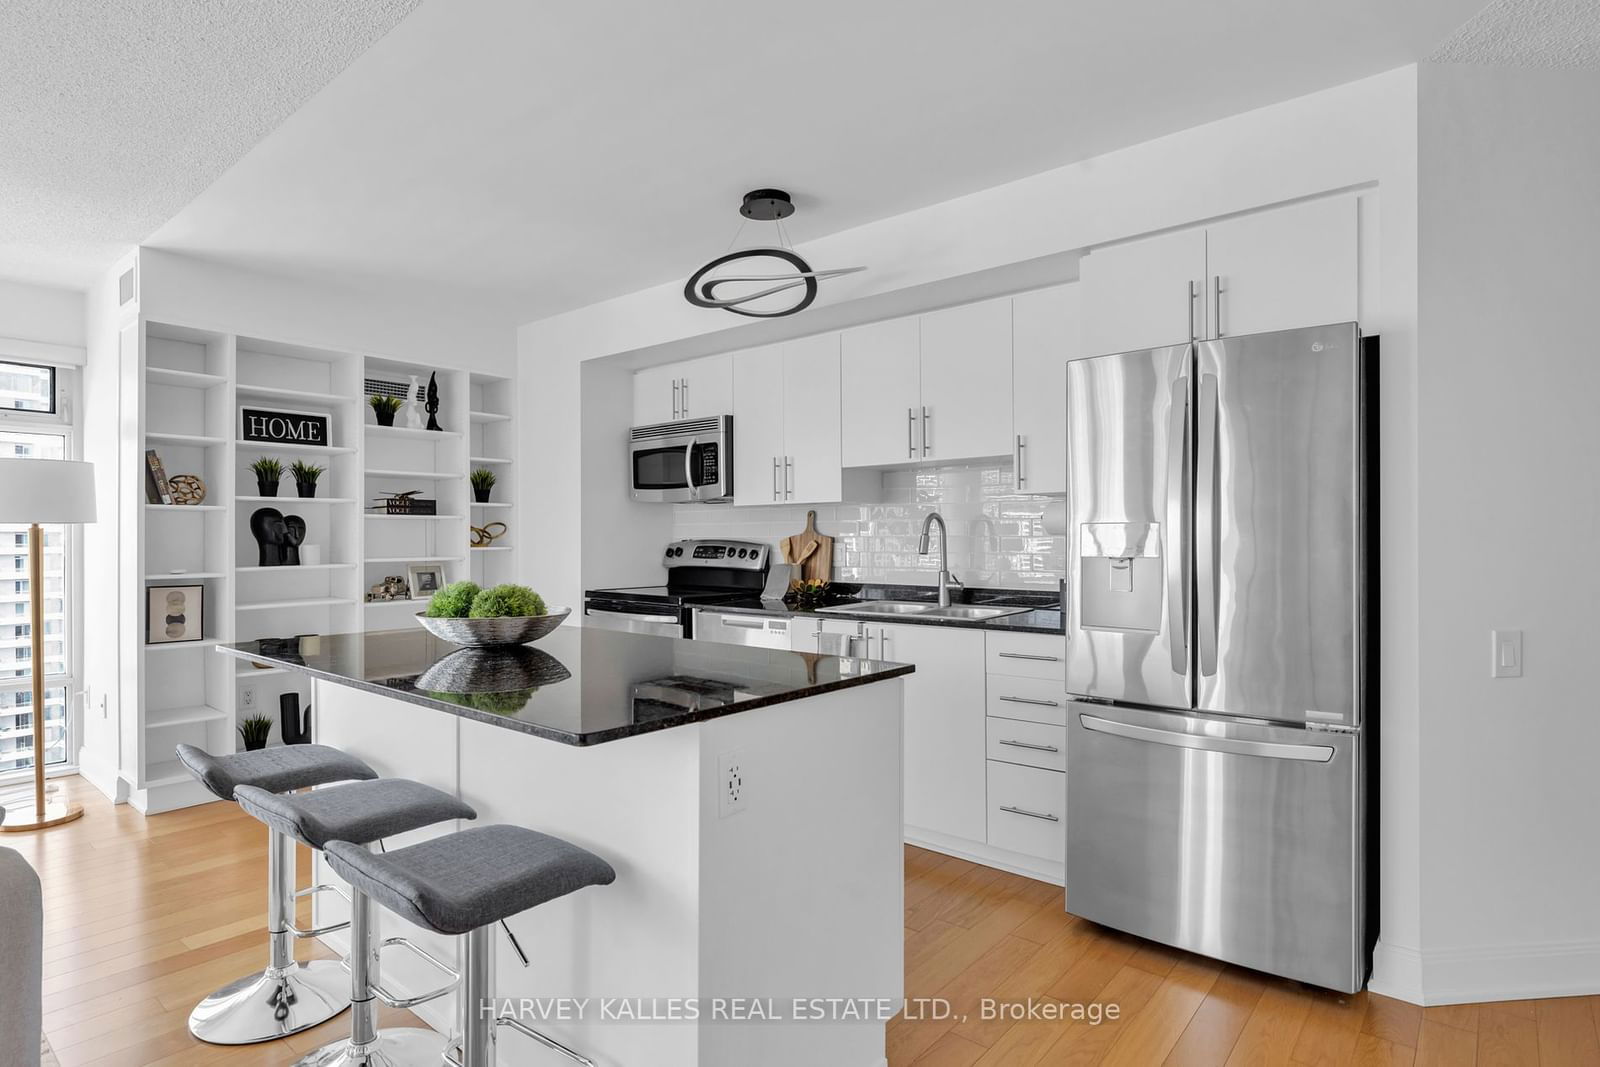
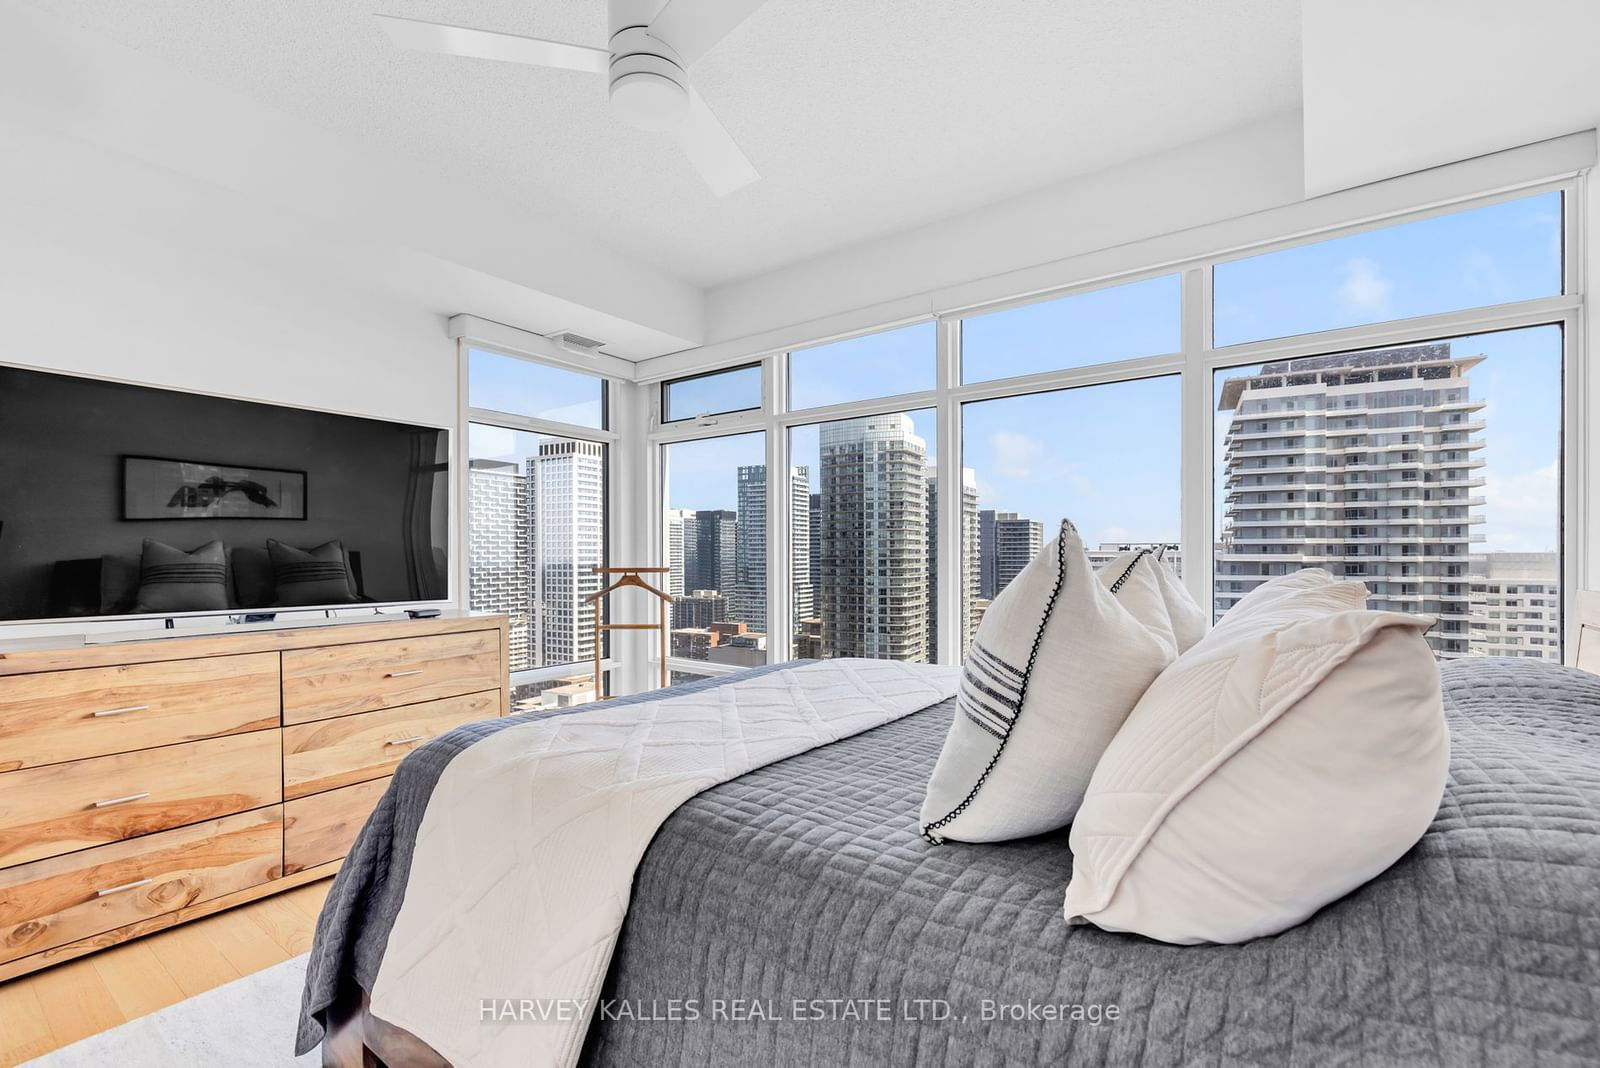
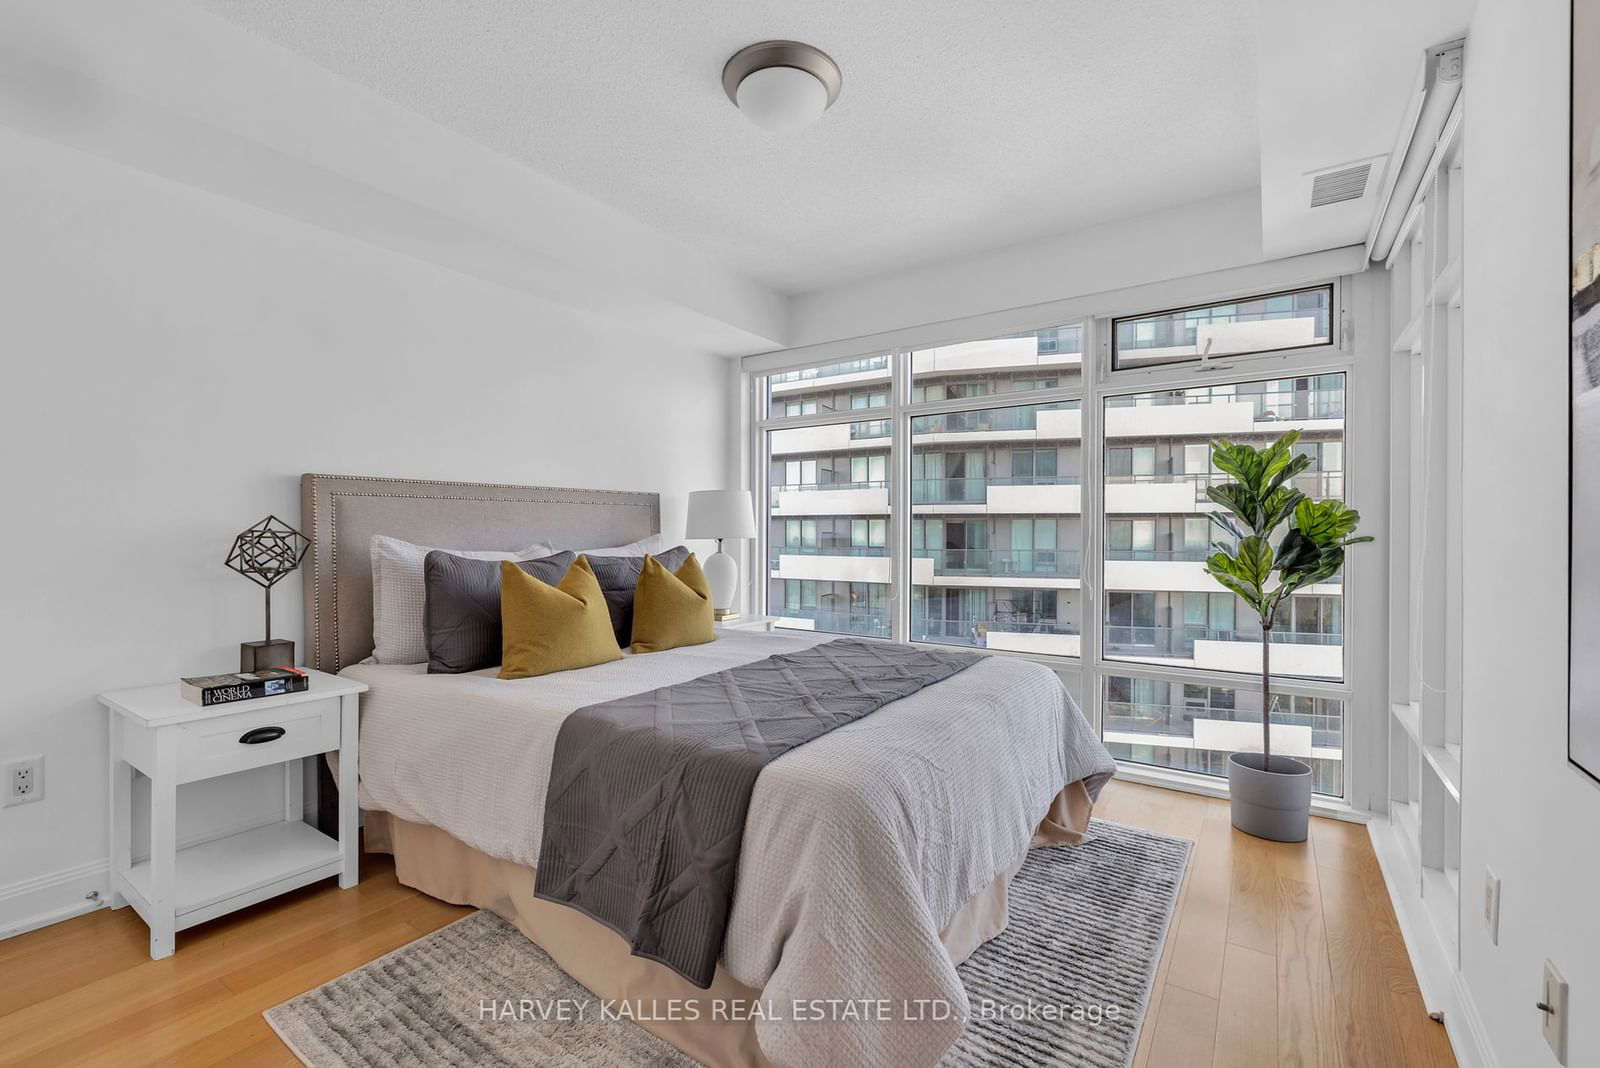
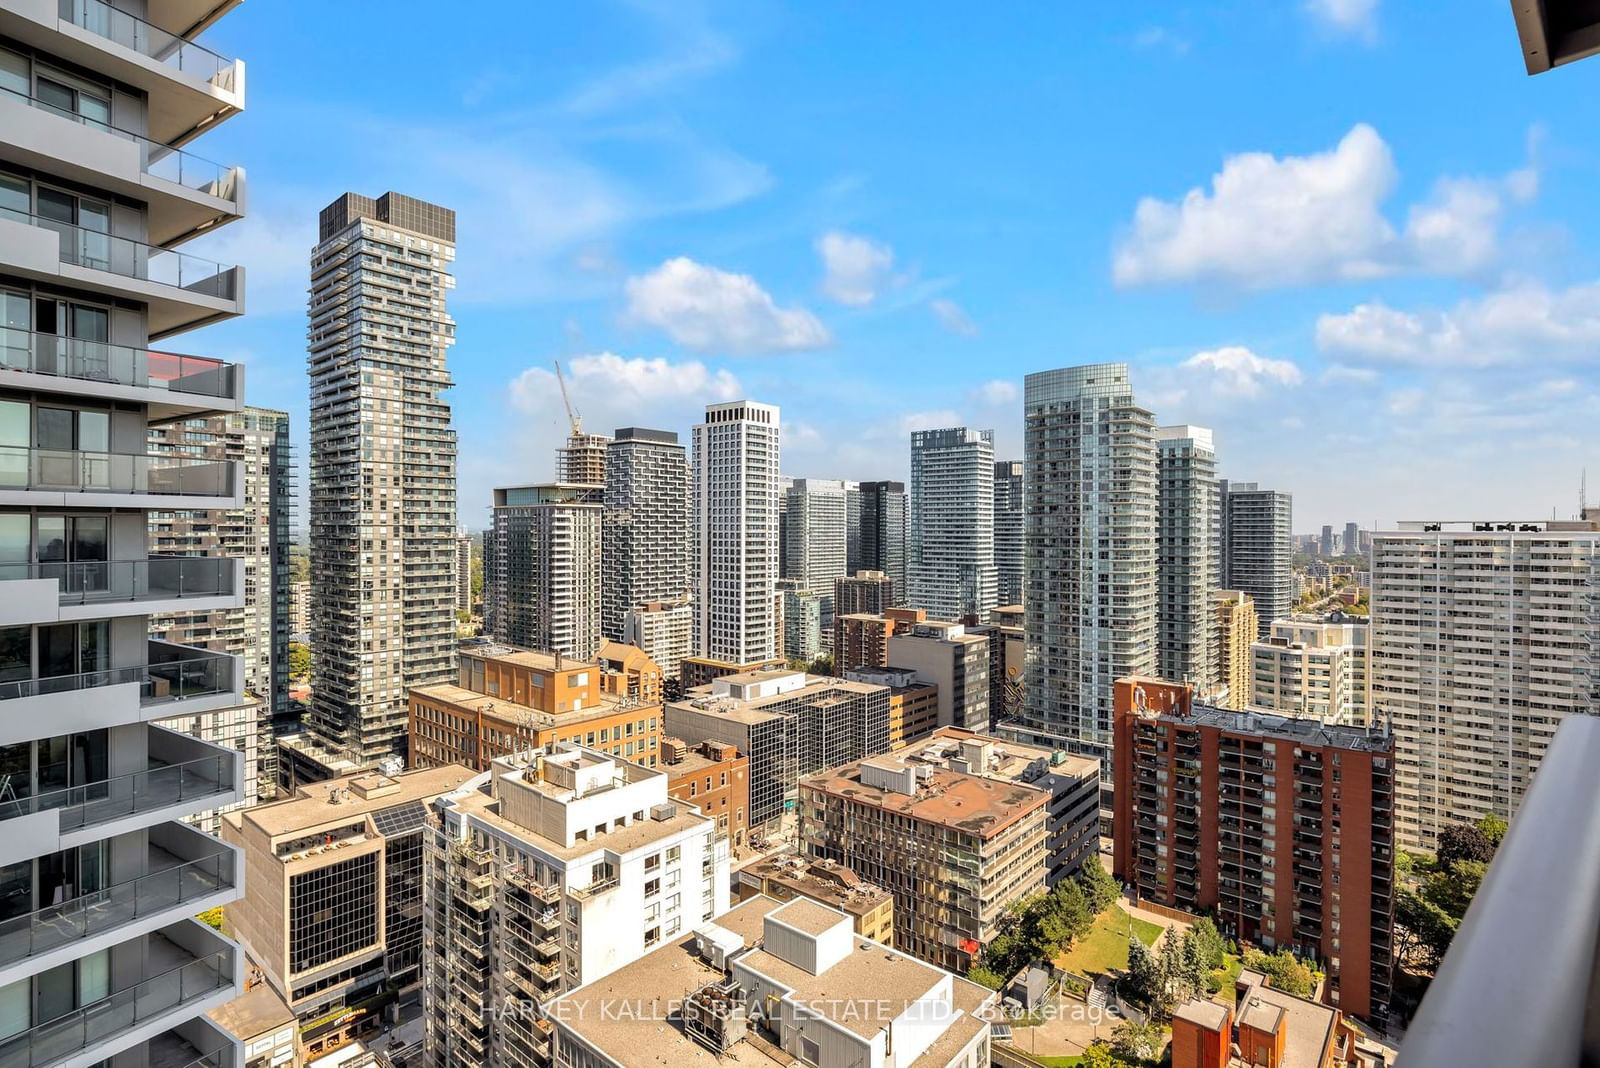
Bright and spacious corner unit at Minto's Quantum North Tower, centrally located at Yonge & Eglinton. This rare floor plan offers two bedrooms, each with its own ensuite bathroom and large walk-in closet, plus a spacious open concept living area and a foyer with a powder room! Upgraded automated blinds and professionally repainted. Sun-drenched and offering dazzling city views this suite is sure to impress. In the building you will find an exceptional offering of amenities including a 24hr Concierge, gym, pool, games rooms, and much more, as well as convenient subway and LRT access across the street. Don't miss the opportunity to call this special condo your next home!
harvey kalles real estate ltd.MLS® #C9377891
Amenities
Explore Neighbourhood
Similar Listings
Demographics
Based on the dissemination area as defined by Statistics Canada. A dissemination area contains, on average, approximately 200 – 400 households.
Price Trends
Maintenance Fees
Building Trends At Quantum North Tower
Days on Strata
List vs Selling Price
Or in other words, the
Offer Competition
Turnover of Units
Property Value
Price Ranking
Sold Units
Rented Units
Best Value Rank
Appreciation Rank
Rental Yield
High Demand
Transaction Insights at 2191 Yonge Street
| Studio | 1 Bed | 1 Bed + Den | 2 Bed | 2 Bed + Den | 3 Bed | 3 Bed + Den | |
|---|---|---|---|---|---|---|---|
| Price Range | No Data | $470,000 - $648,000 | $640,000 - $748,000 | No Data | $893,000 - $1,140,000 | No Data | No Data |
| Avg. Cost Per Sqft | No Data | $855 | $966 | No Data | $918 | No Data | No Data |
| Price Range | No Data | $2,350 - $2,600 | $2,500 - $3,400 | $1,880 - $3,800 | $3,800 - $4,200 | No Data | No Data |
| Avg. Wait for Unit Availability | No Data | 59 Days | 32 Days | 86 Days | 40 Days | 381 Days | No Data |
| Avg. Wait for Unit Availability | No Data | 27 Days | 14 Days | 53 Days | 30 Days | No Data | No Data |
| Ratio of Units in Building | 2% | 23% | 38% | 13% | 25% | 2% | 1% |
Transactions vs Inventory
Total number of units listed and sold in Mount Pleasant West
