1127 - 50 Power St
Listing History
Unit Highlights
Maintenance Fees
Utility Type
- Air Conditioning
- Central Air
- Heat Source
- Gas
- Heating
- Forced Air
Room Dimensions
About this Listing
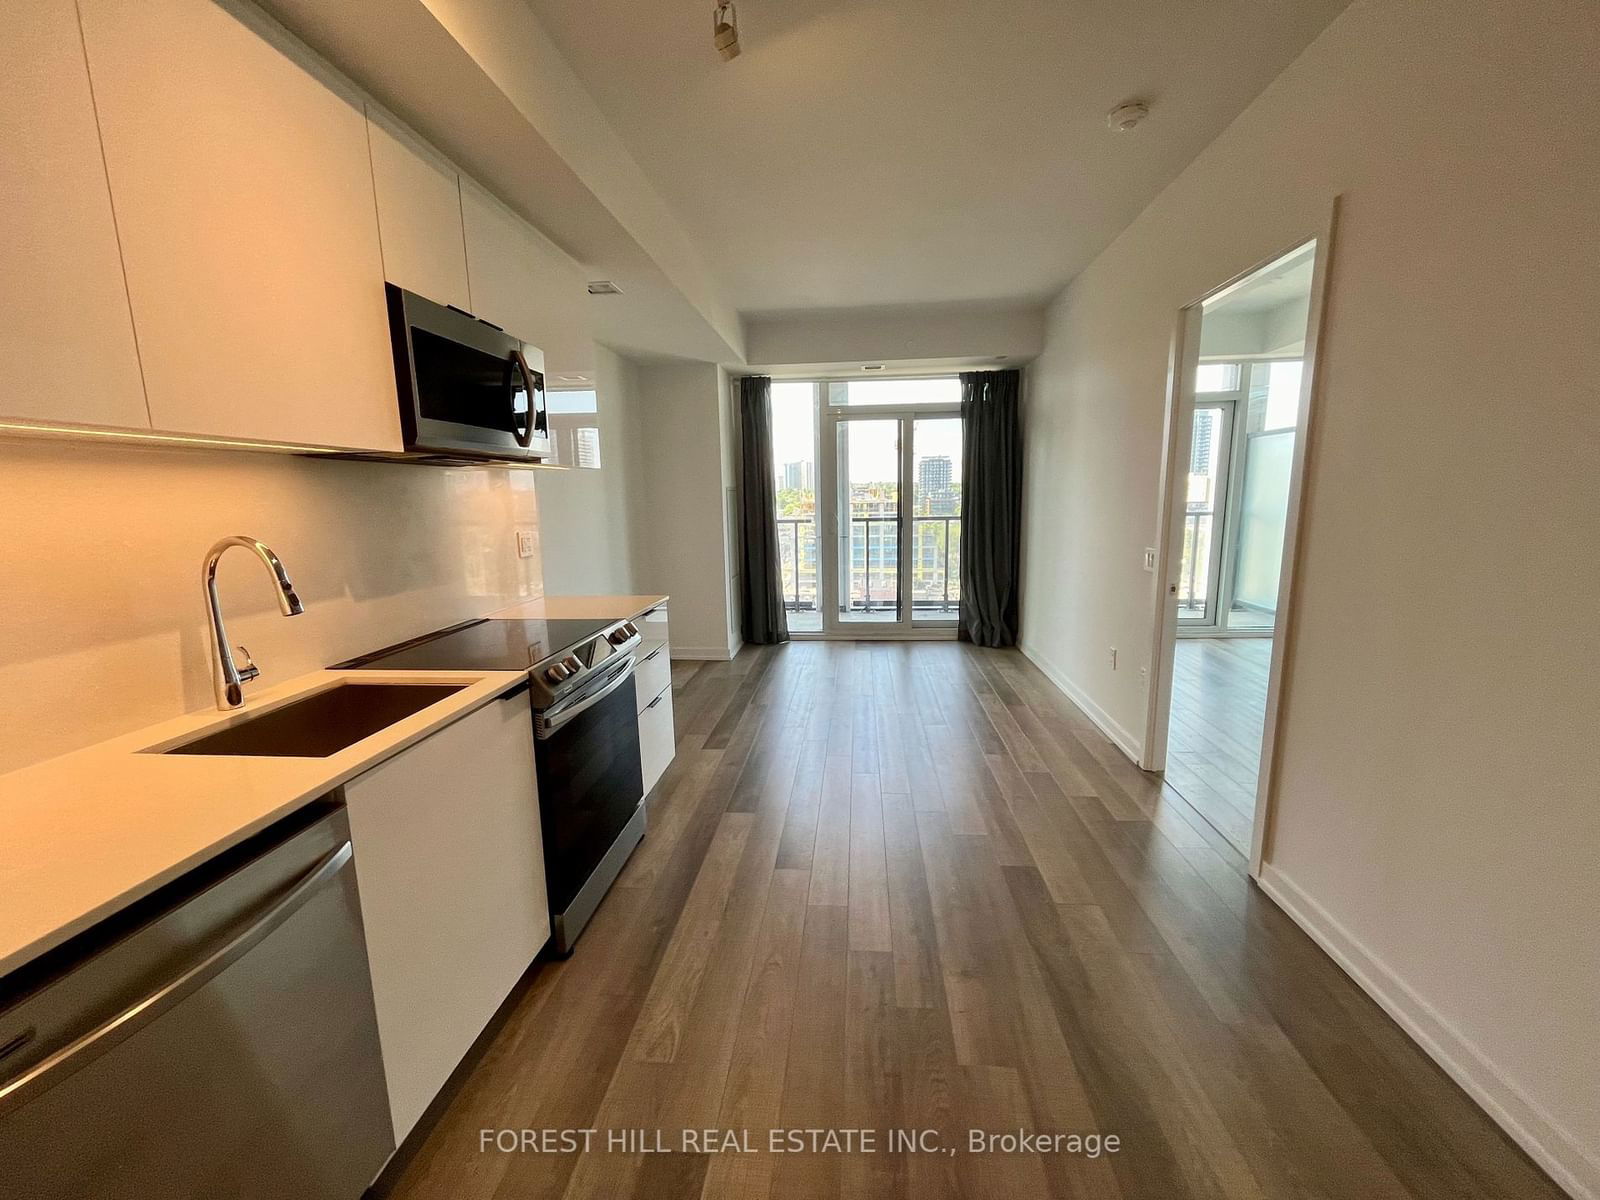
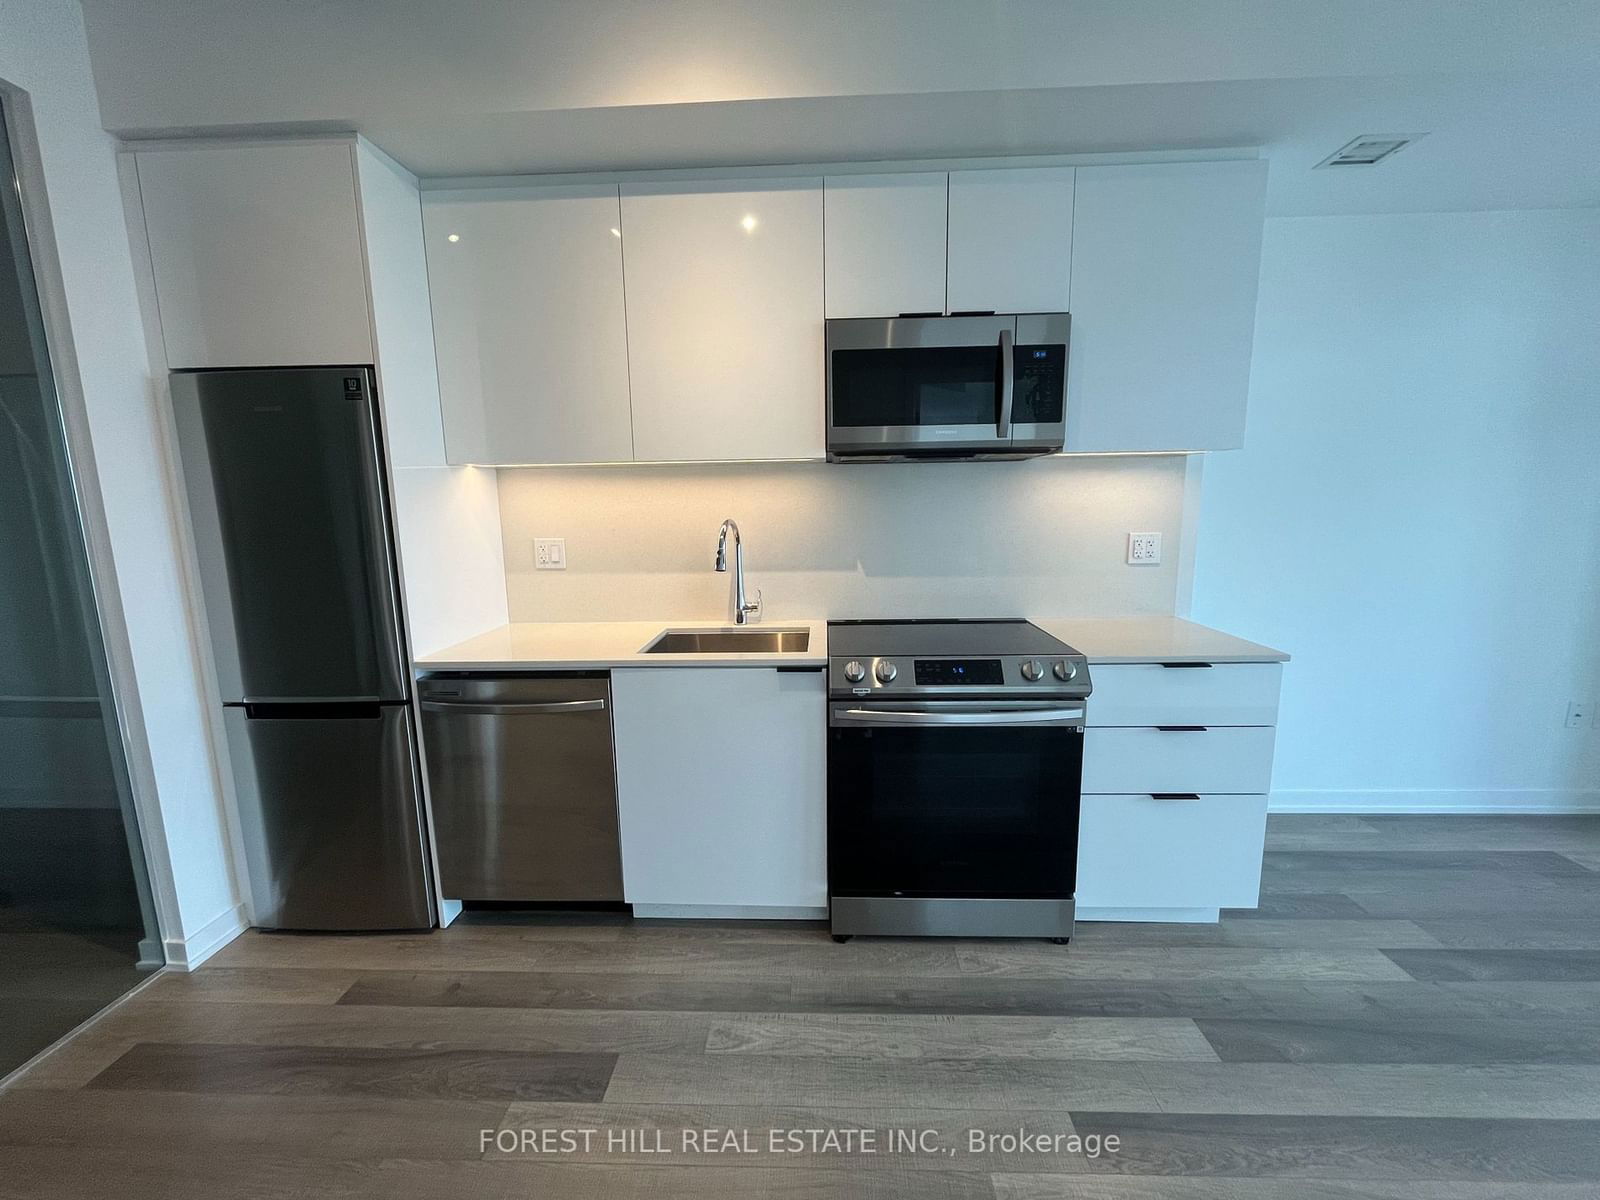
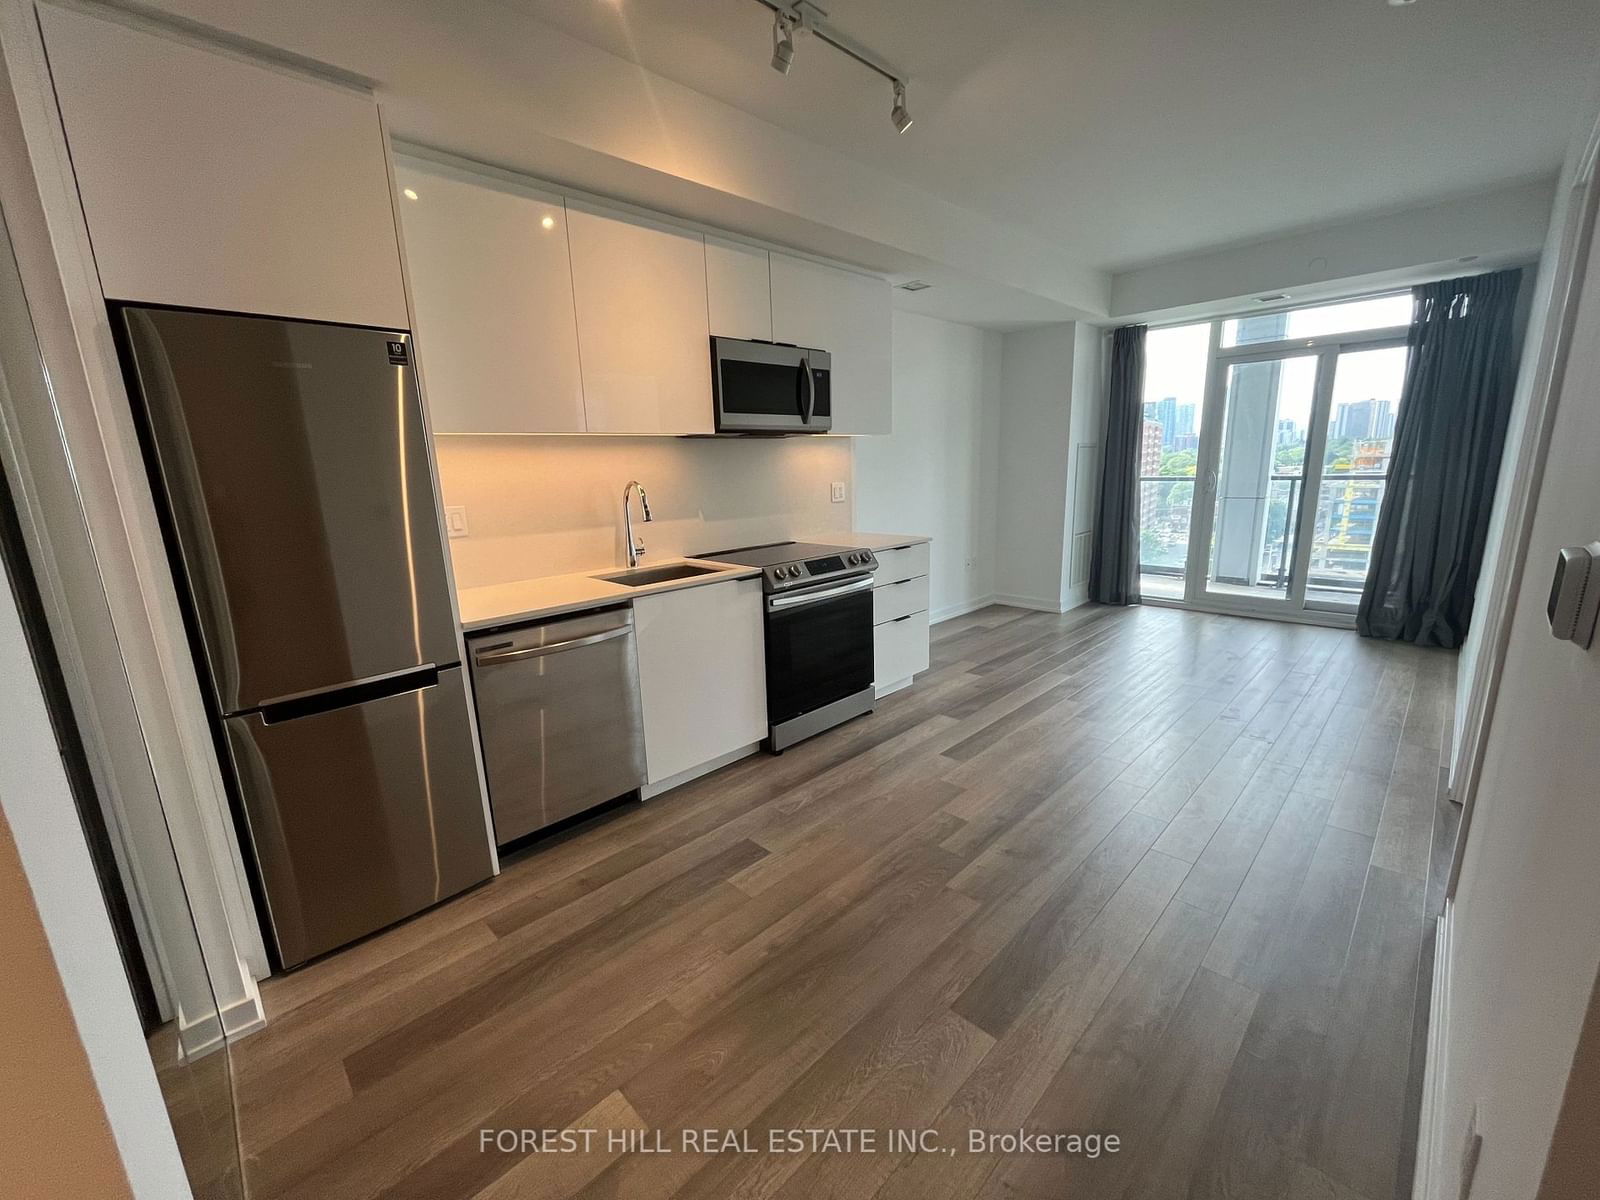
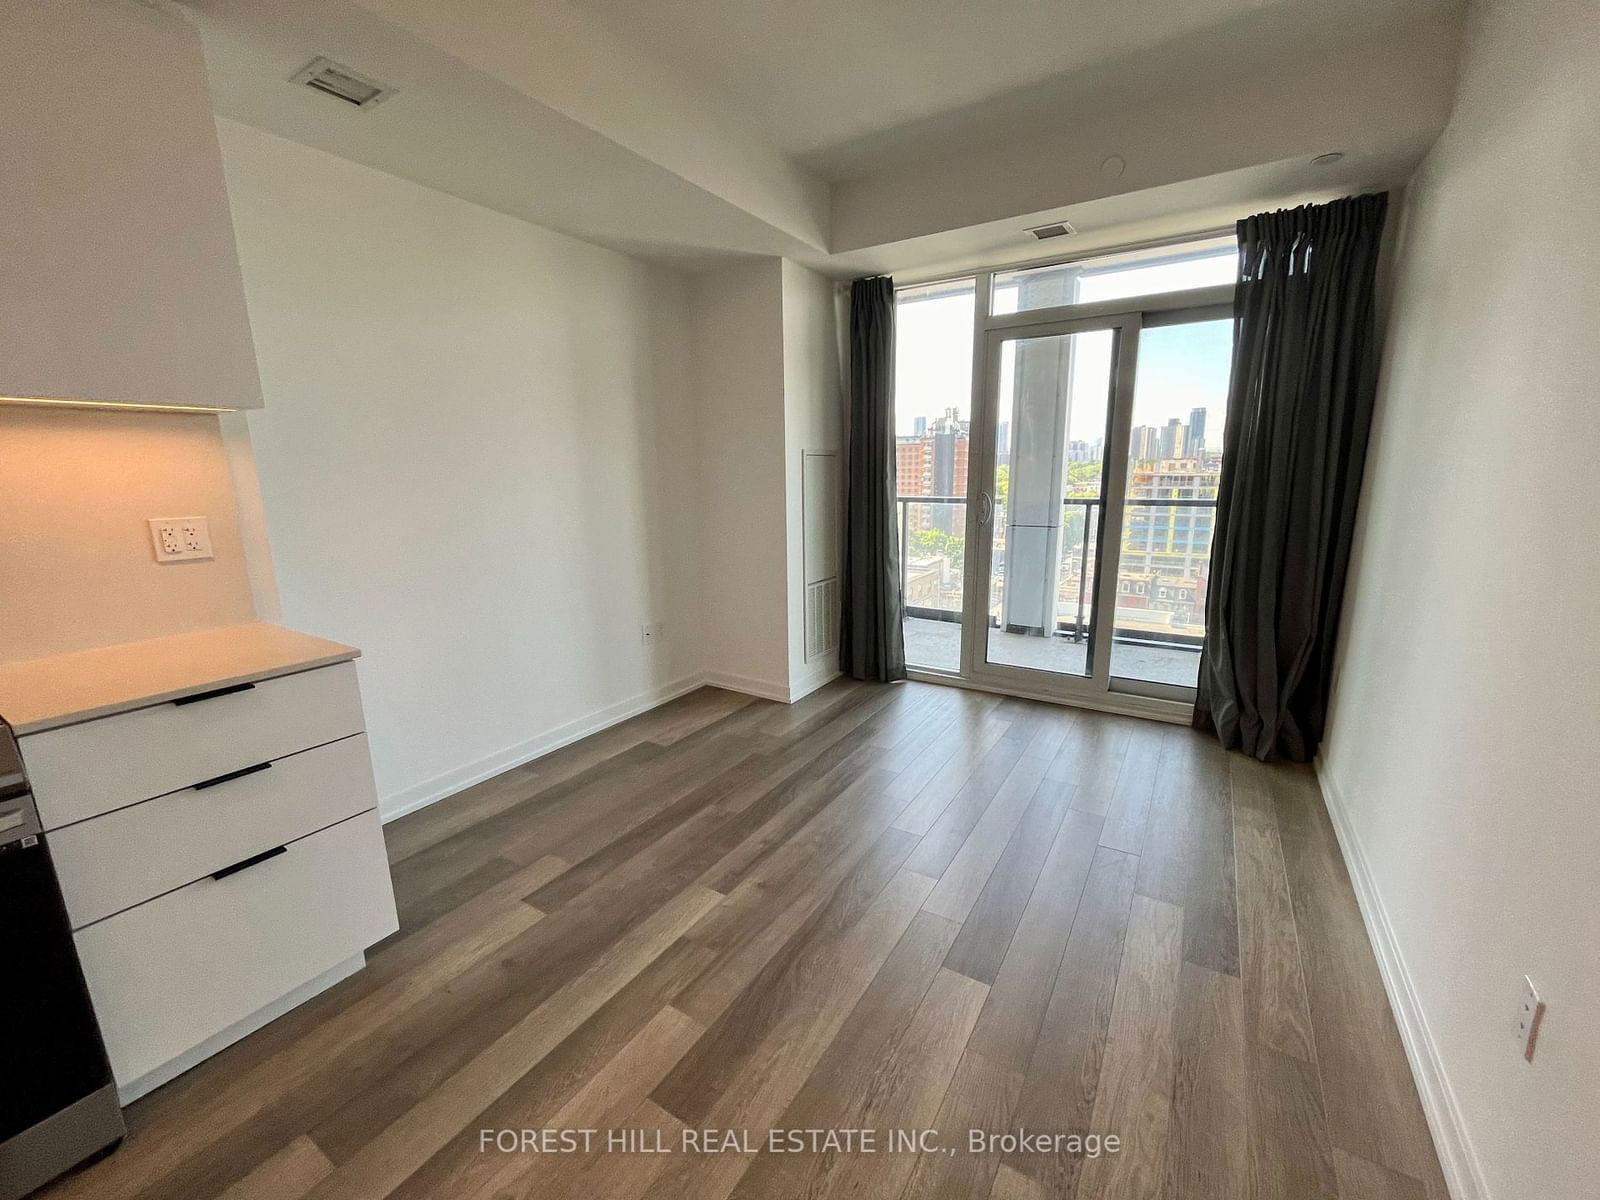
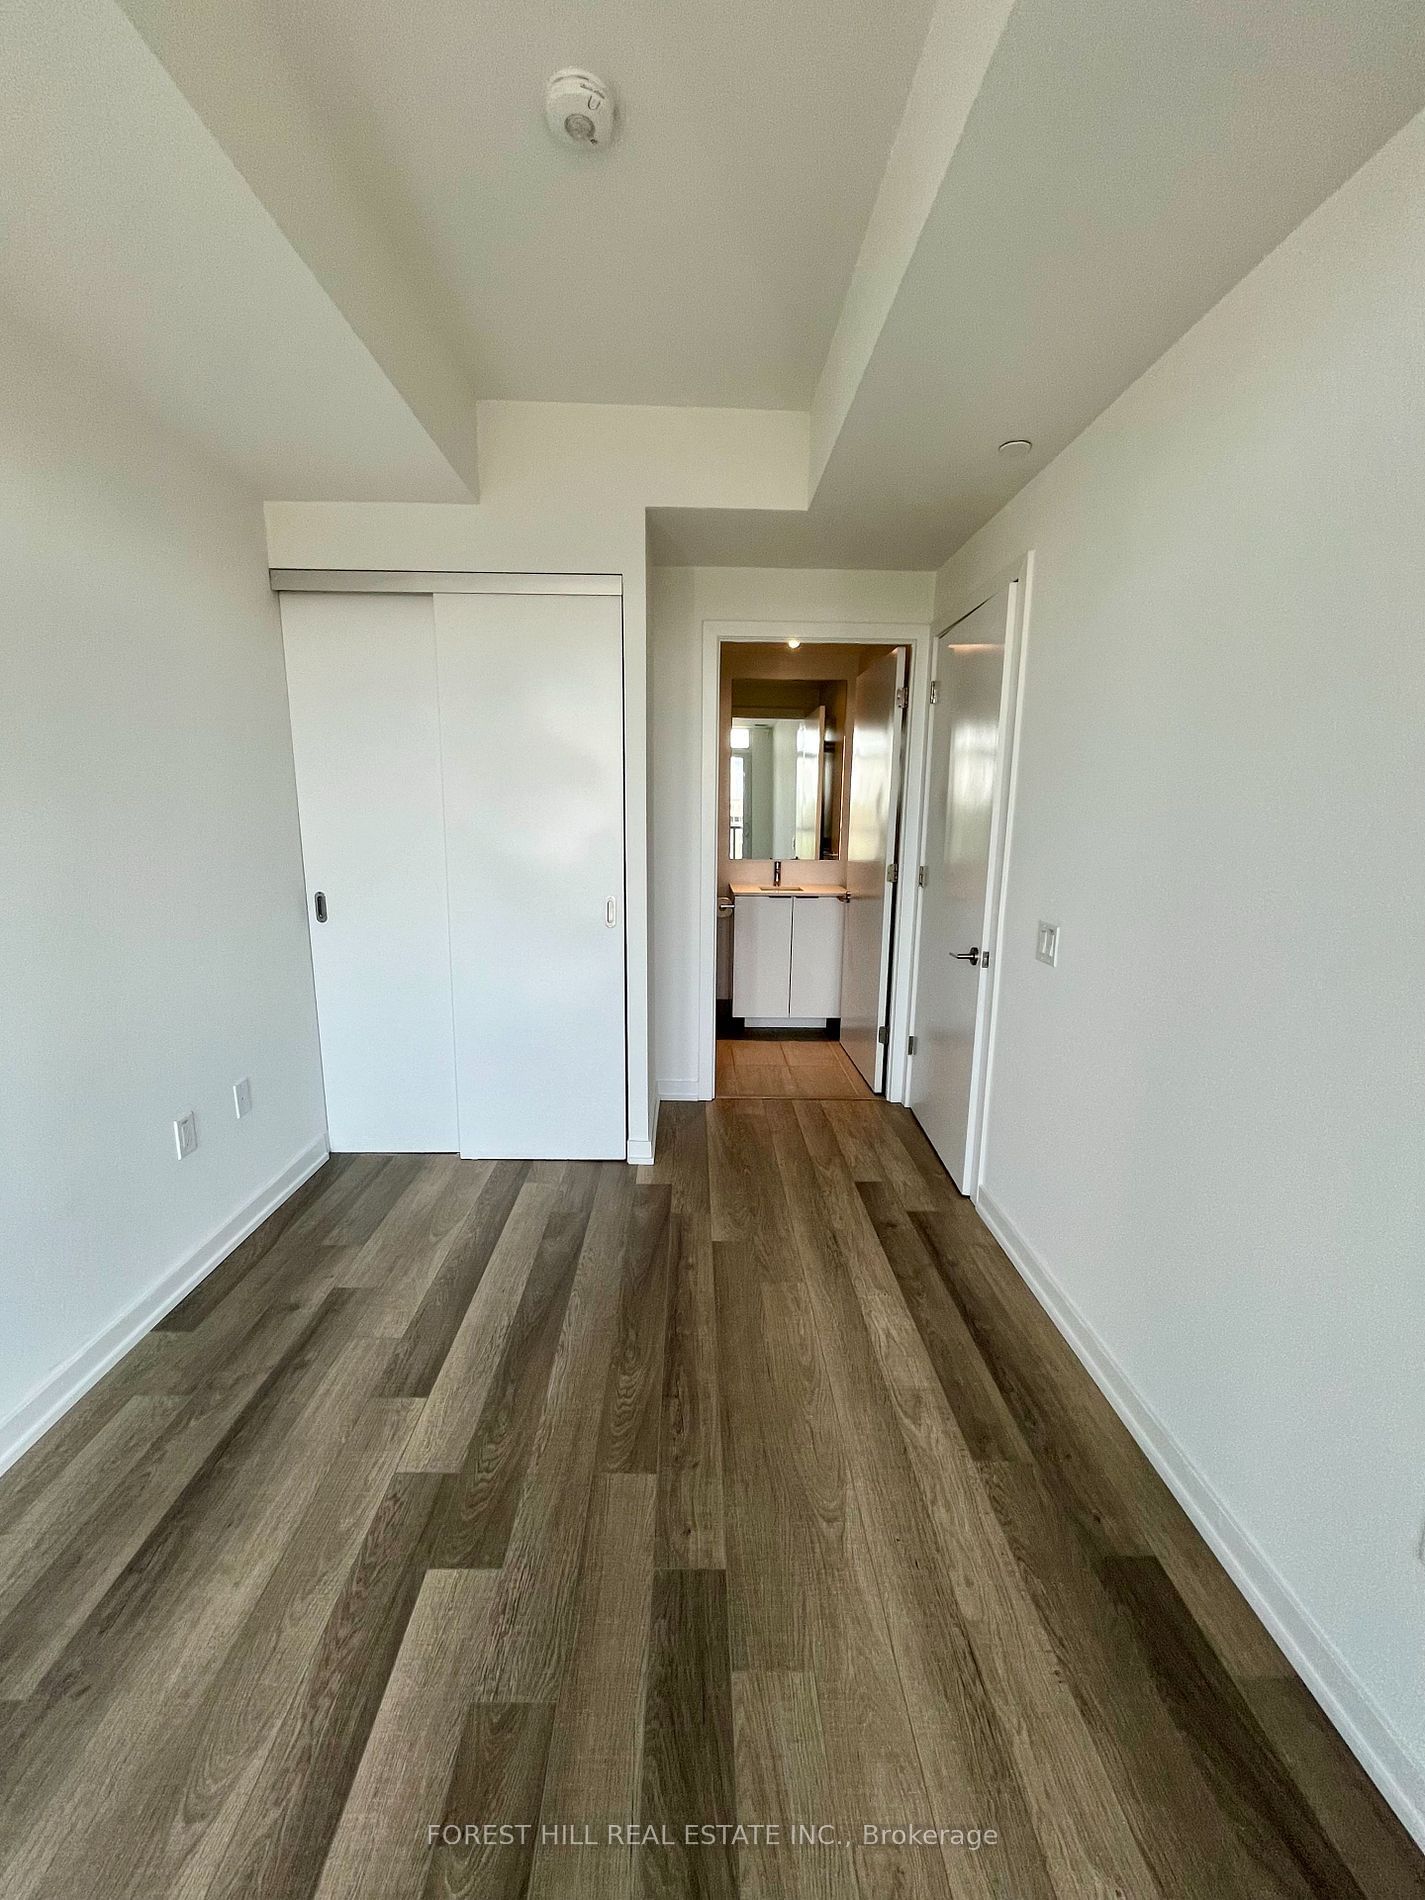
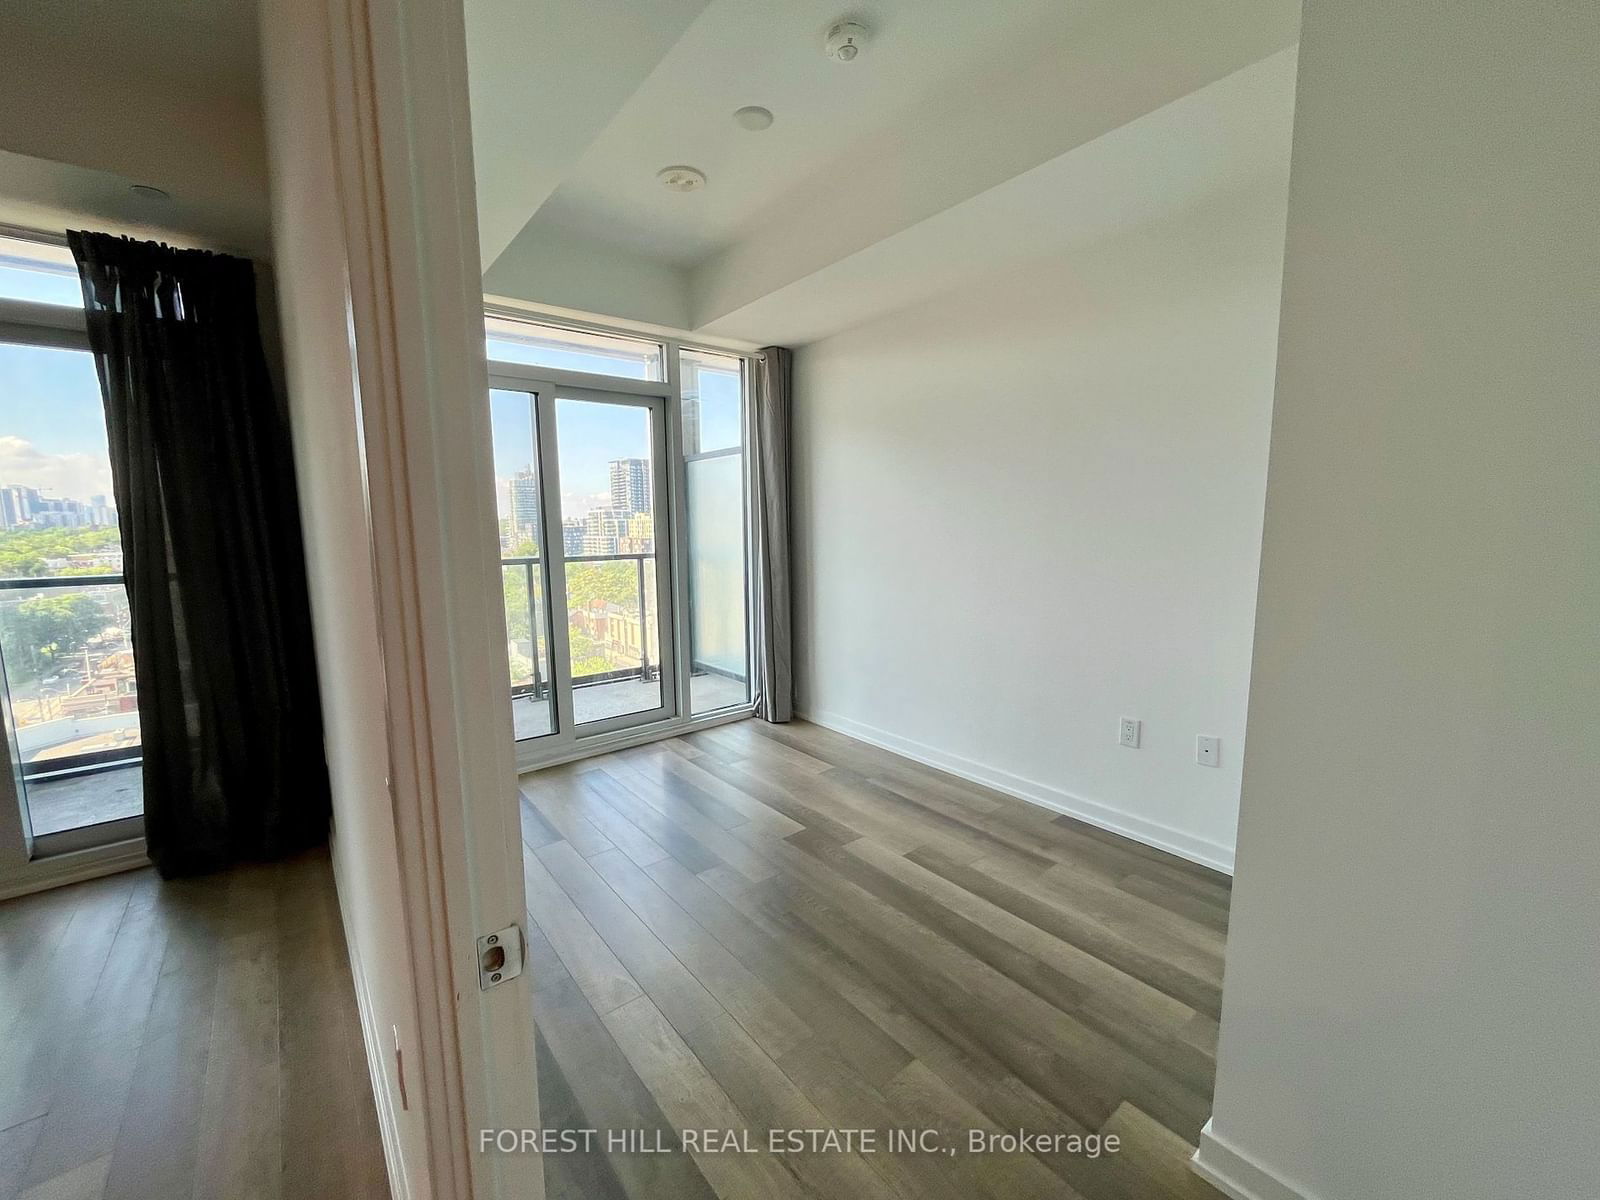
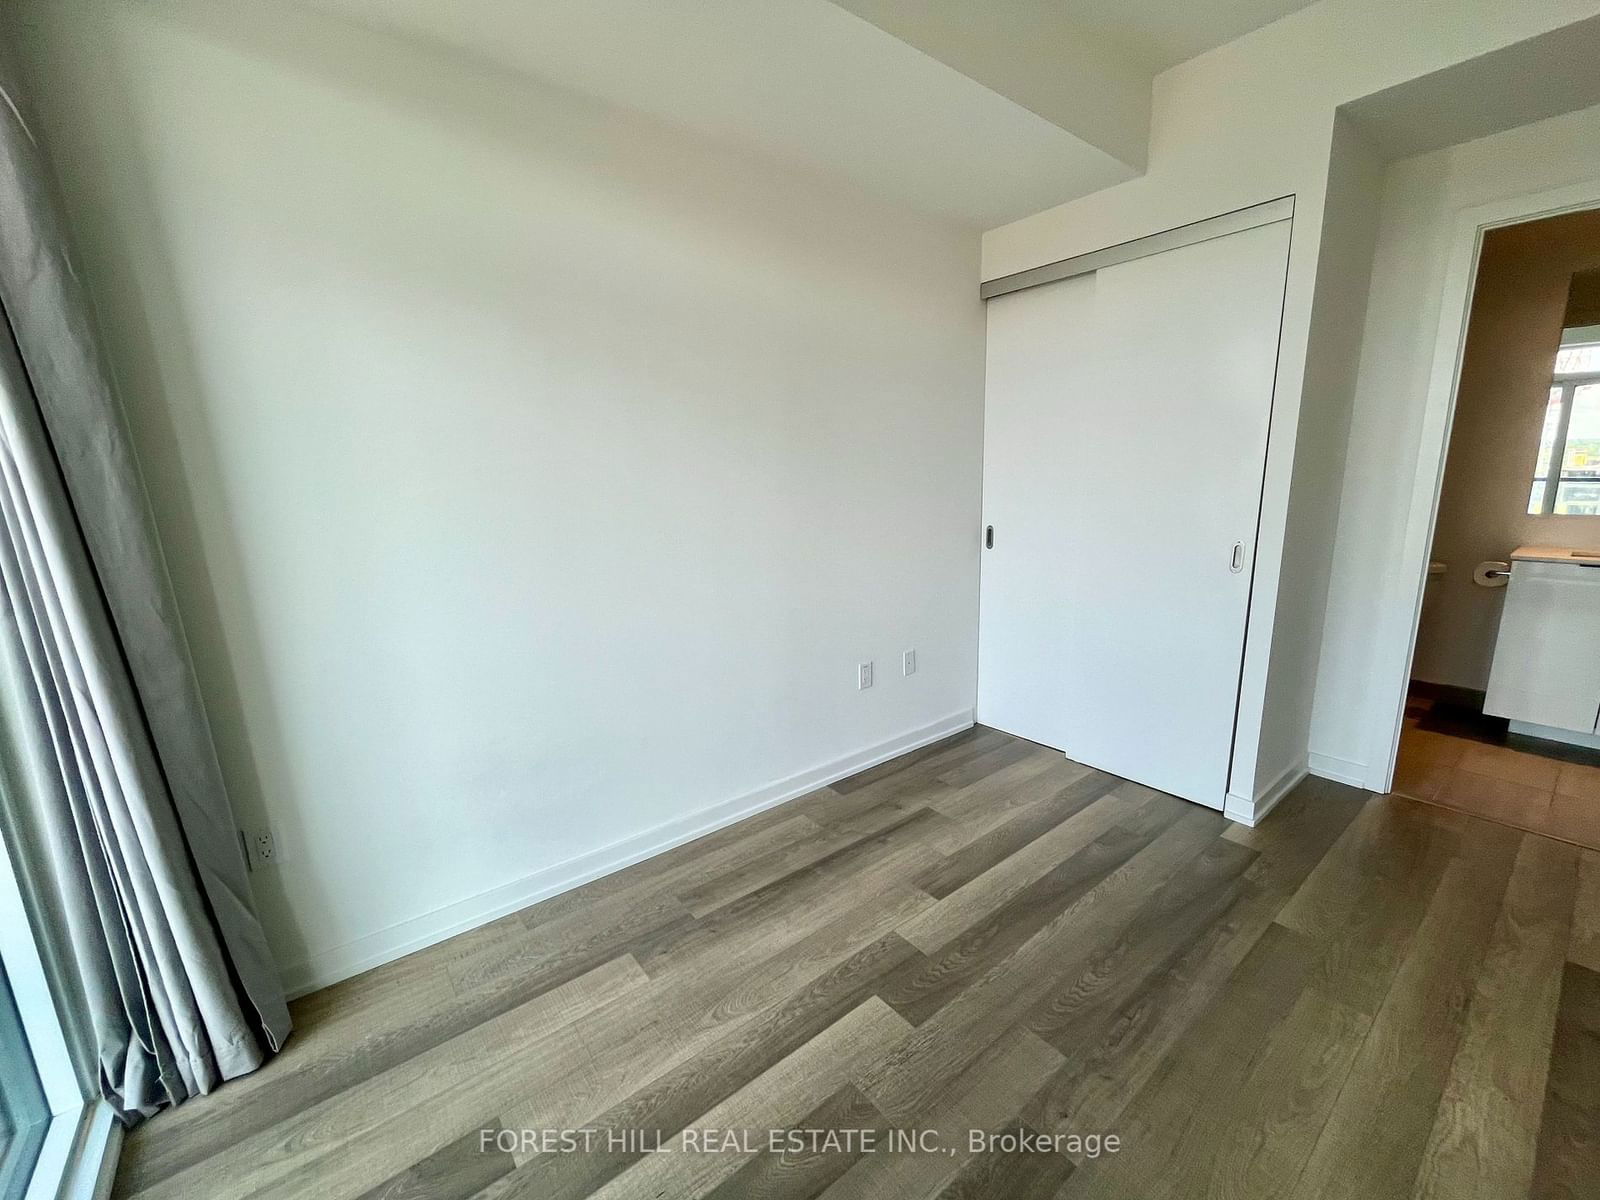
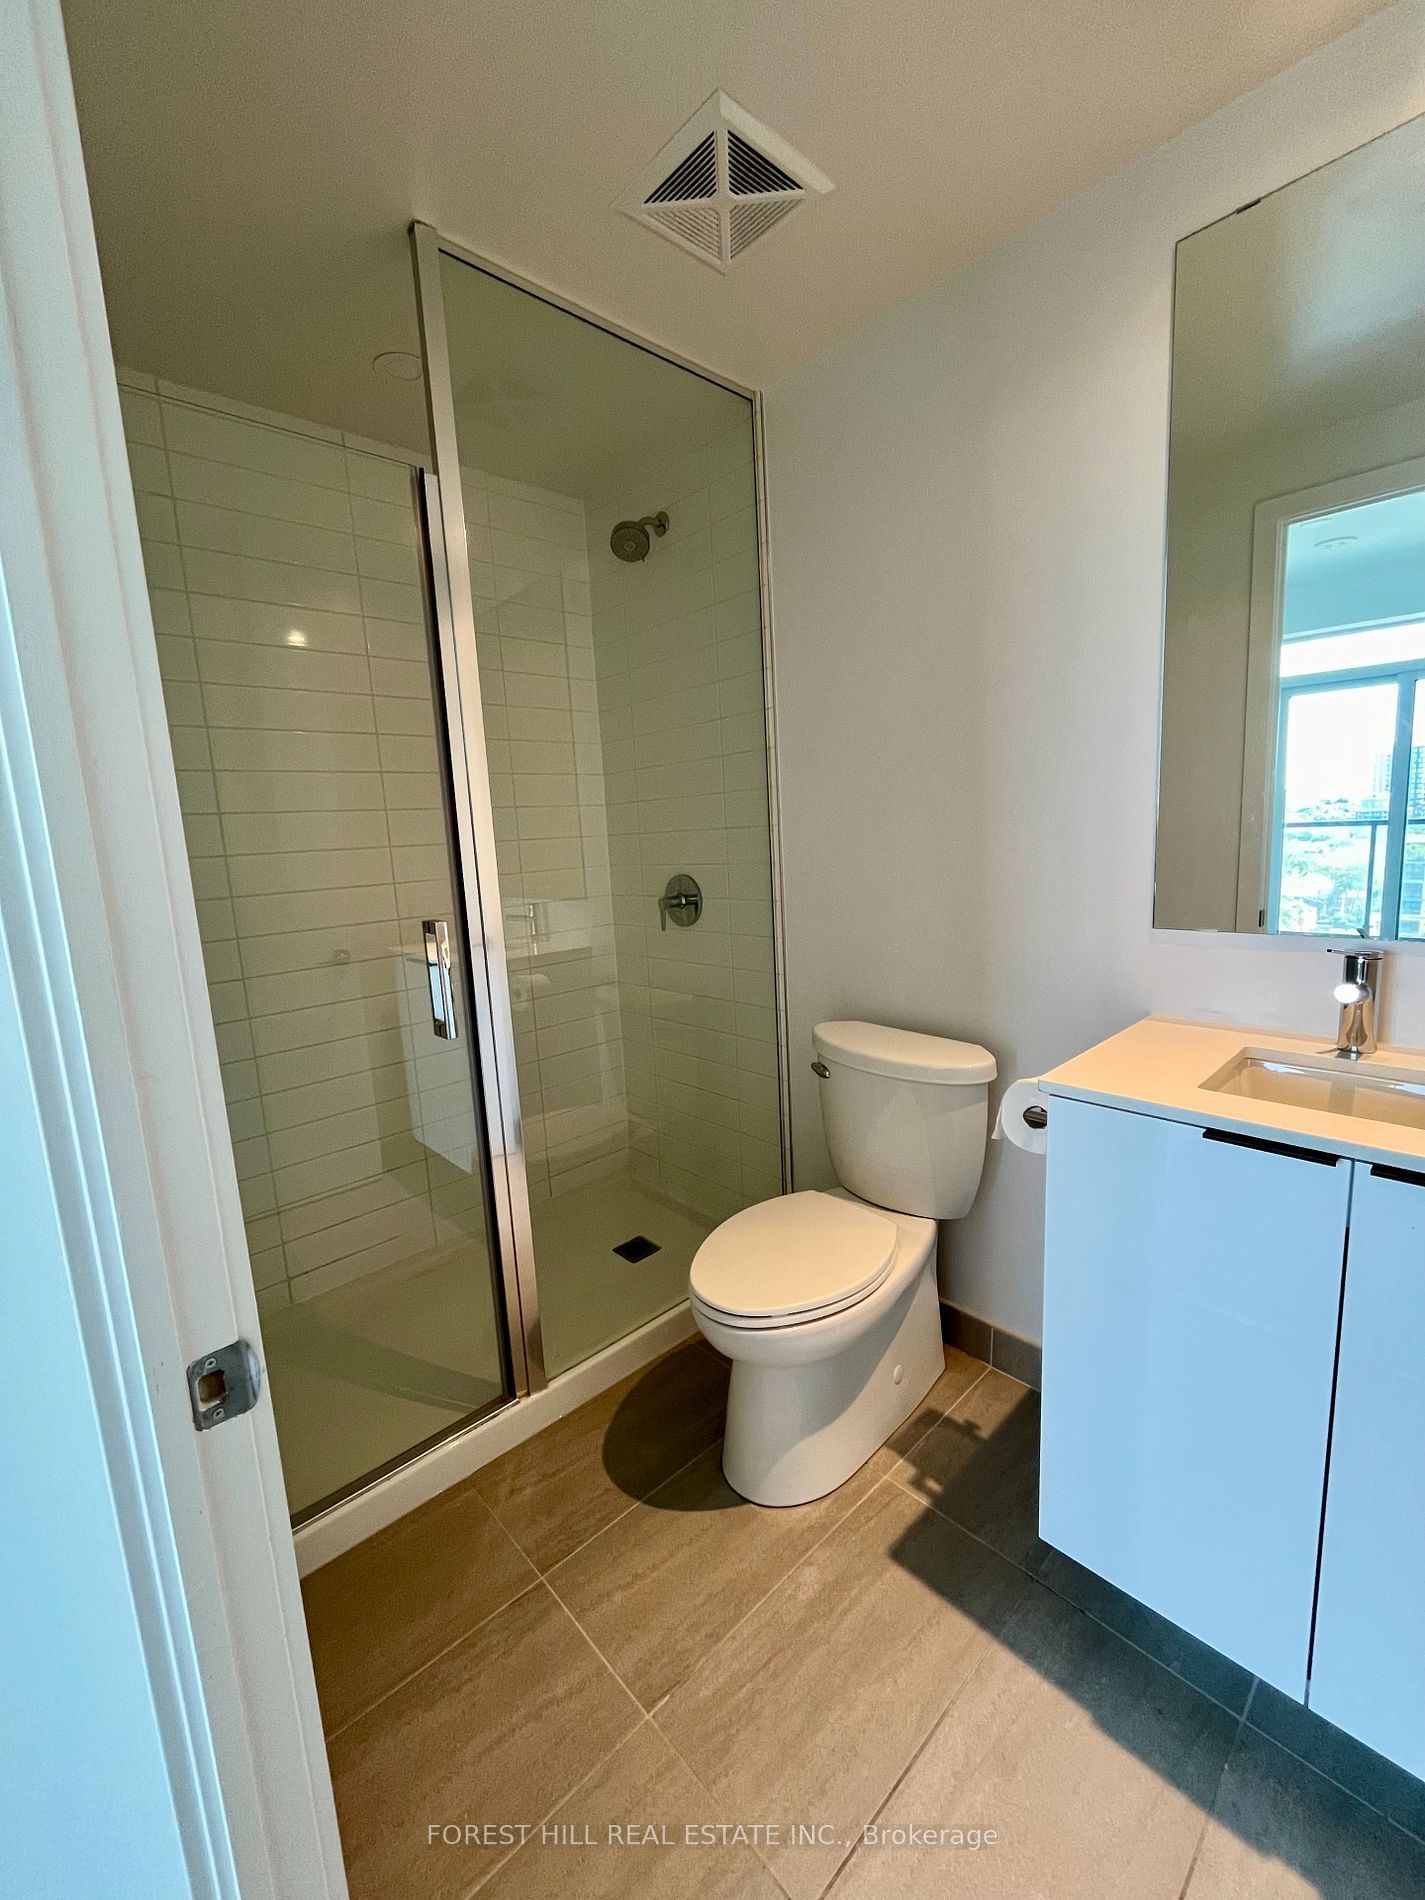
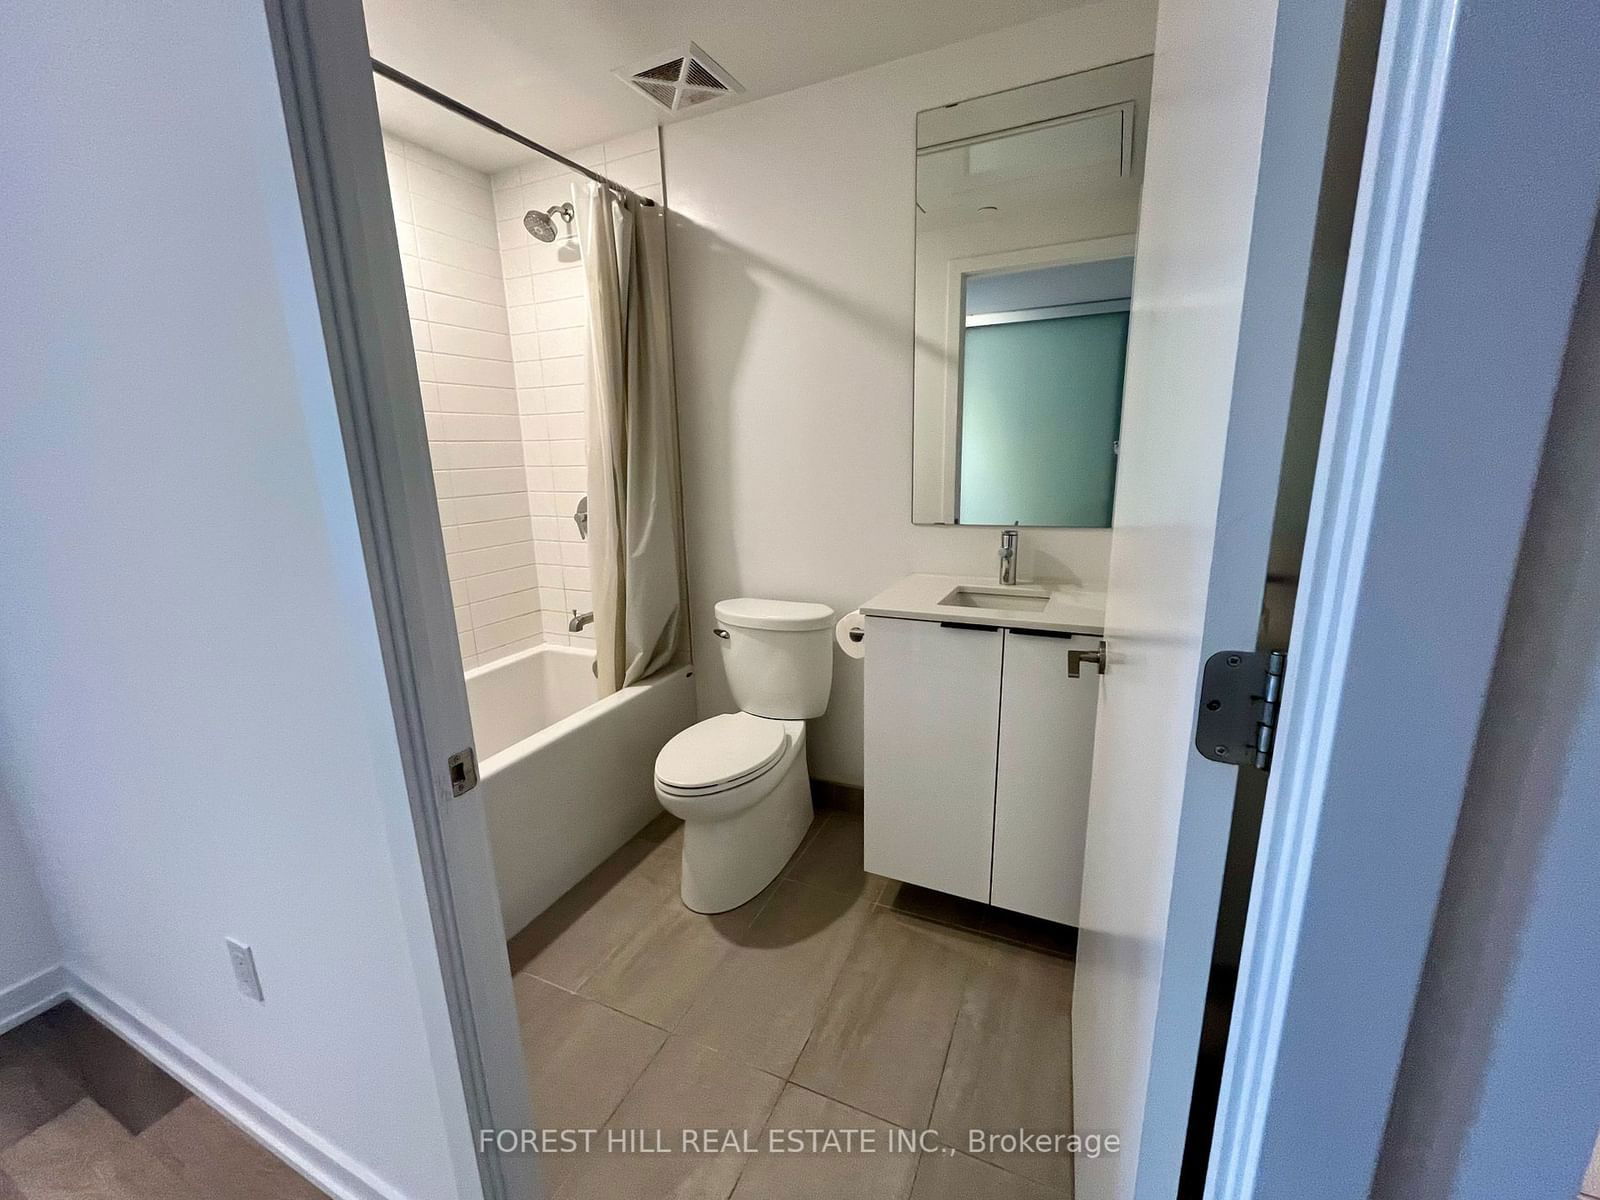
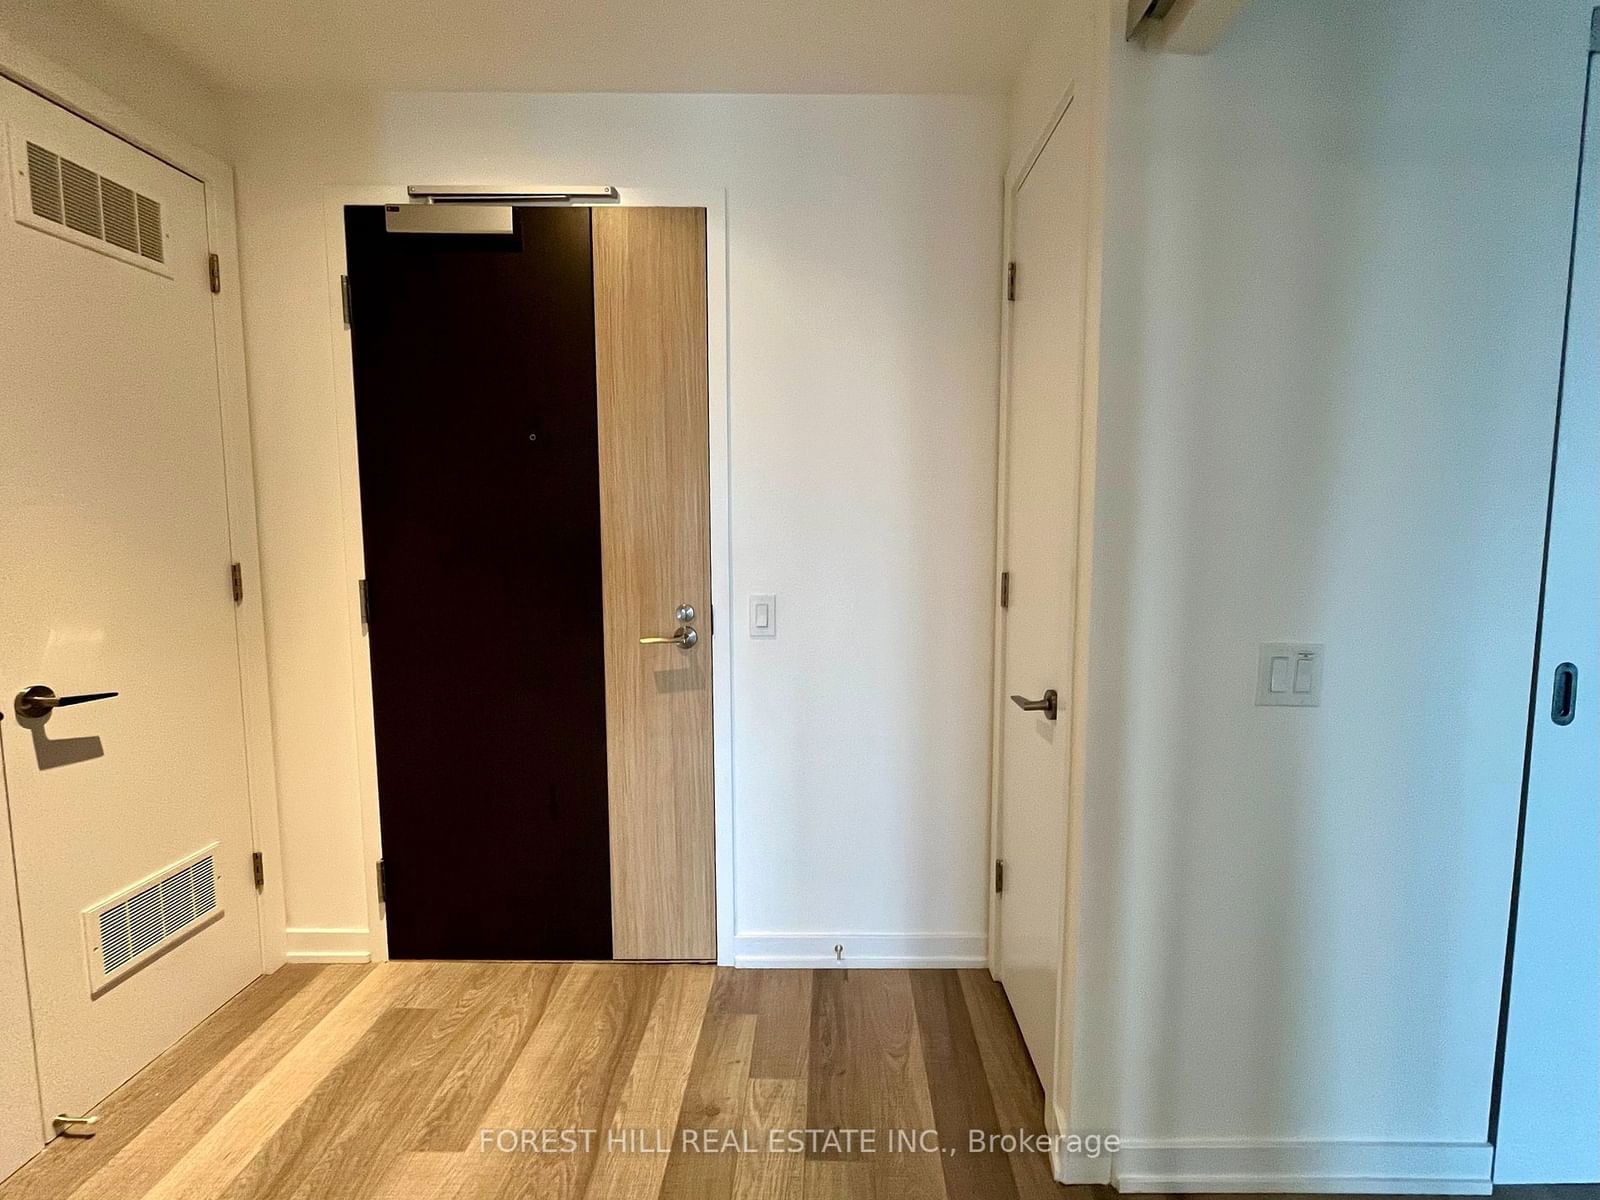
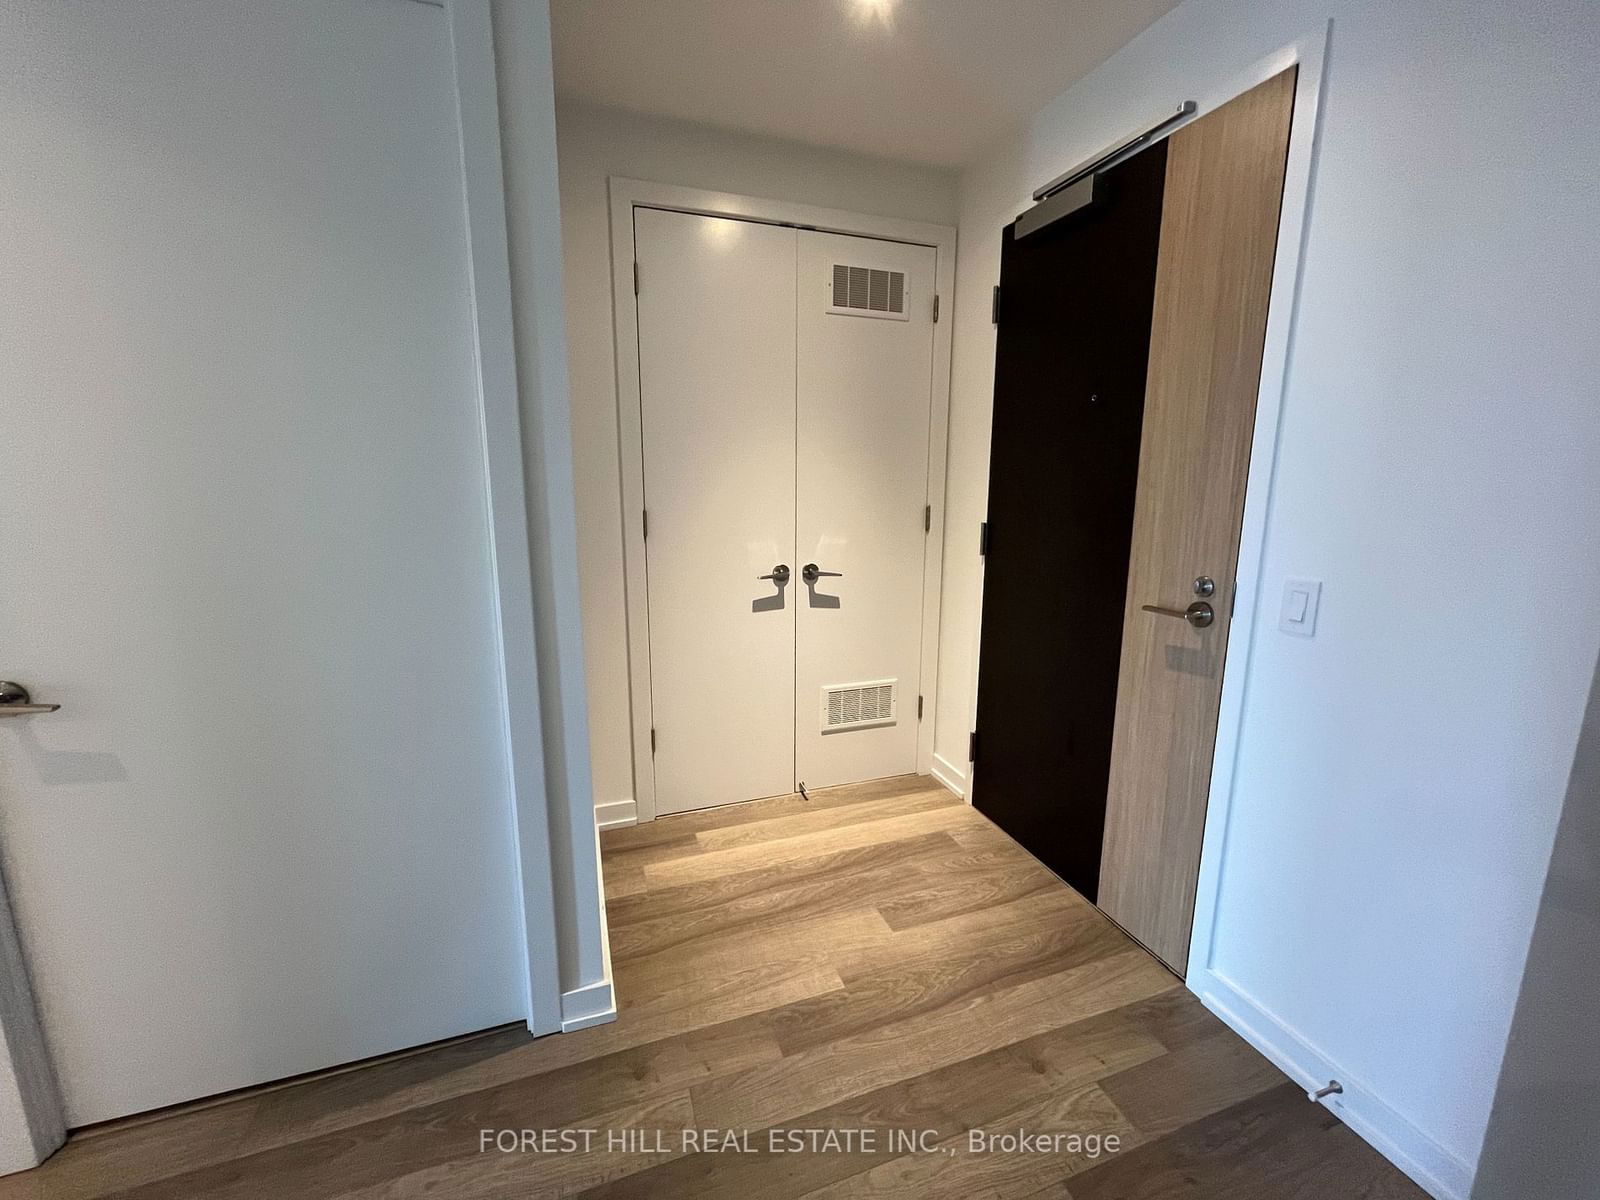
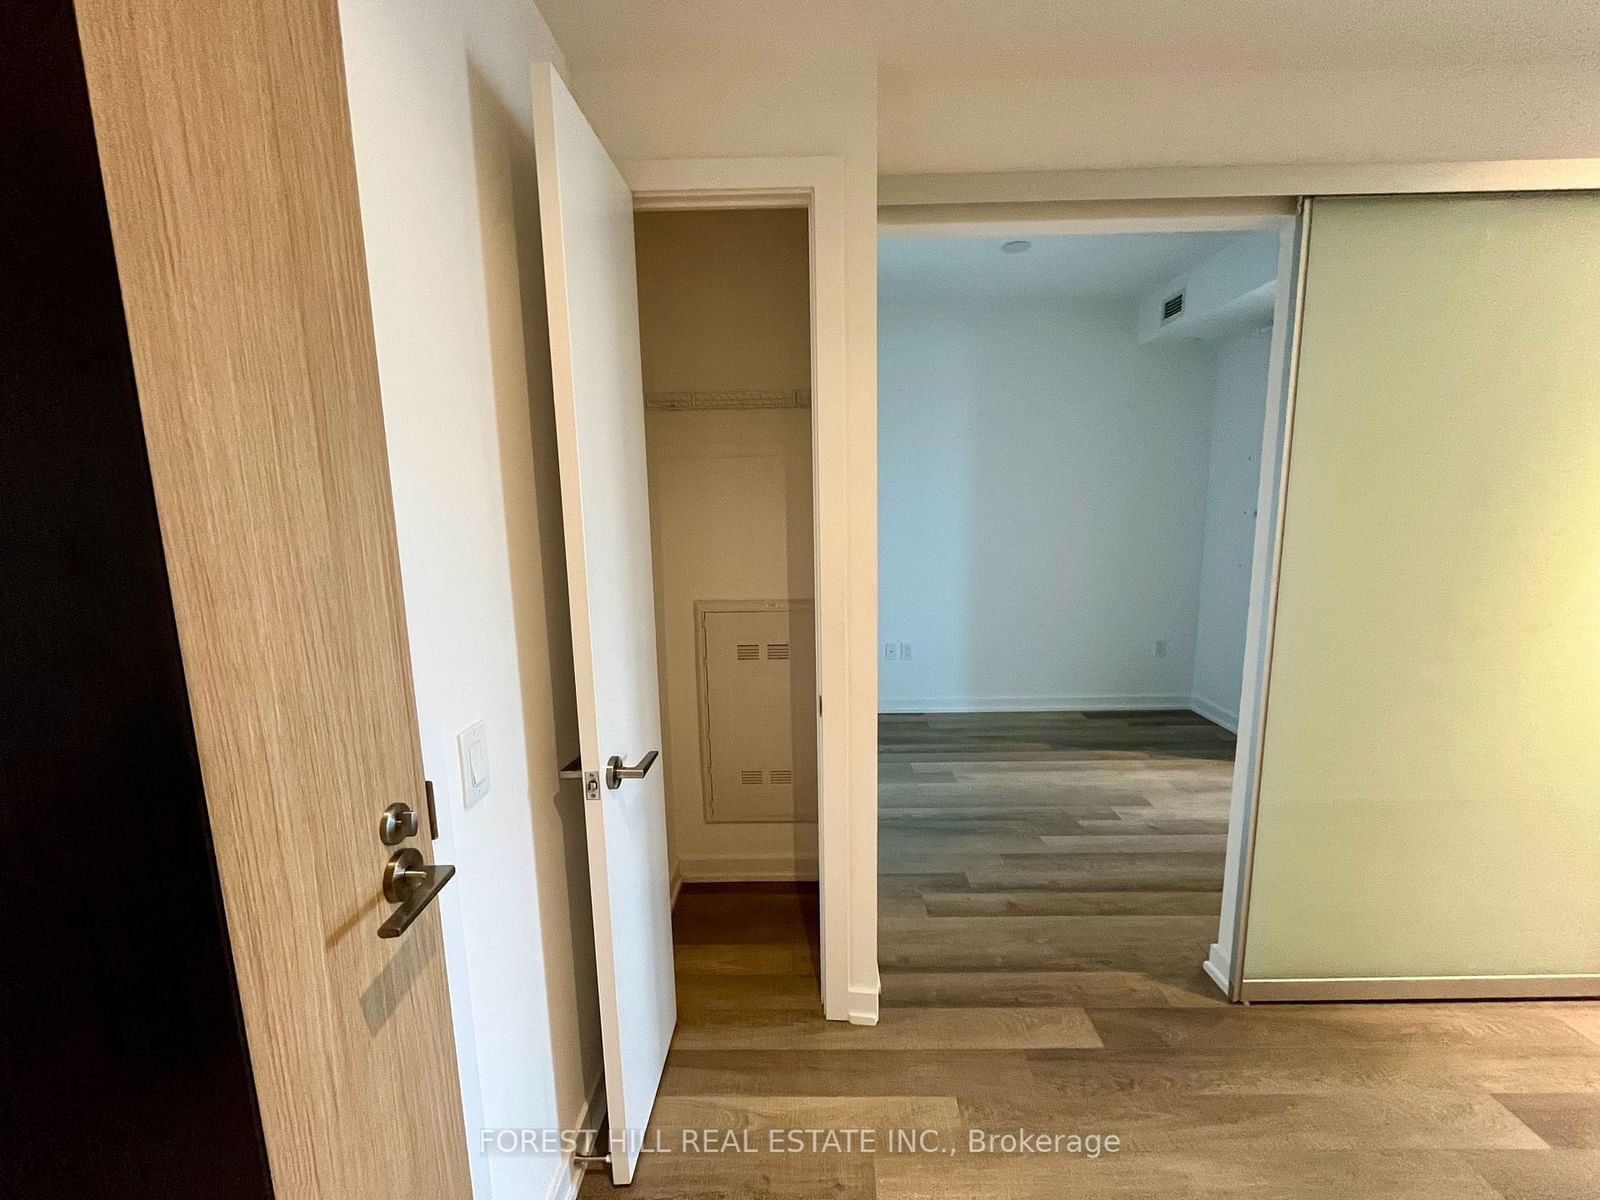
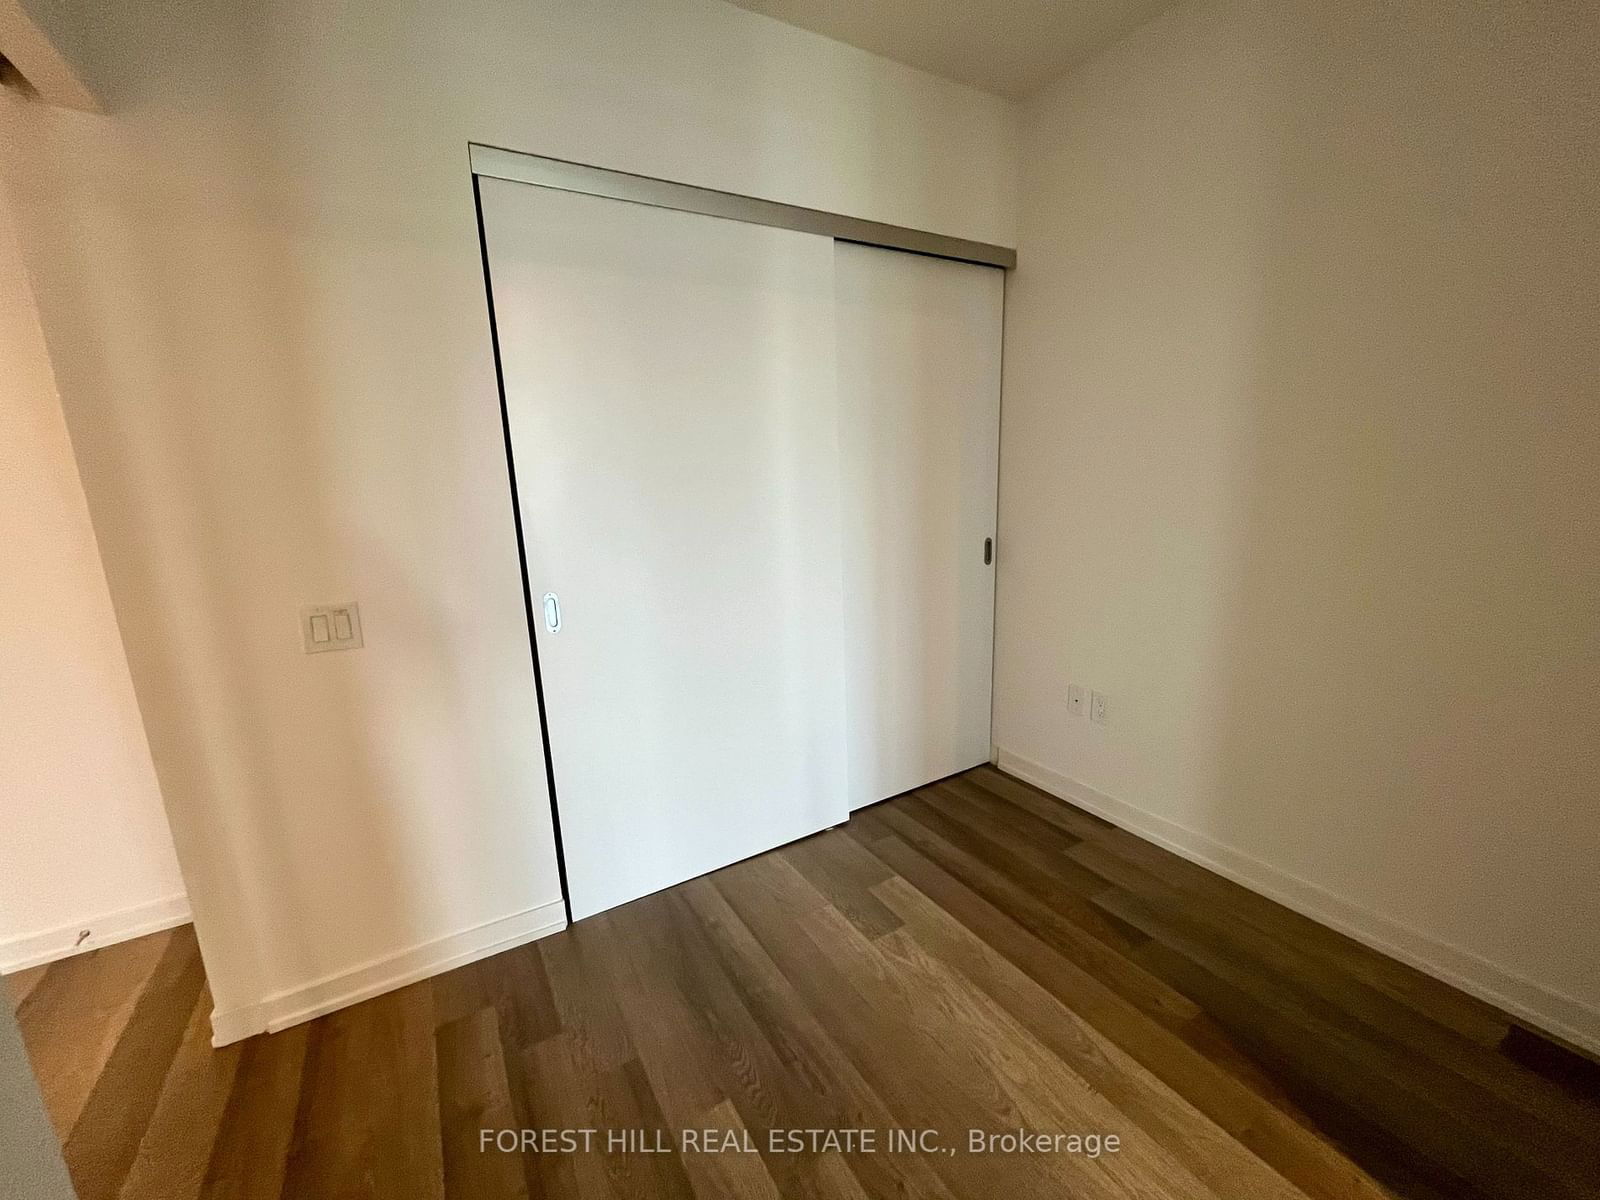
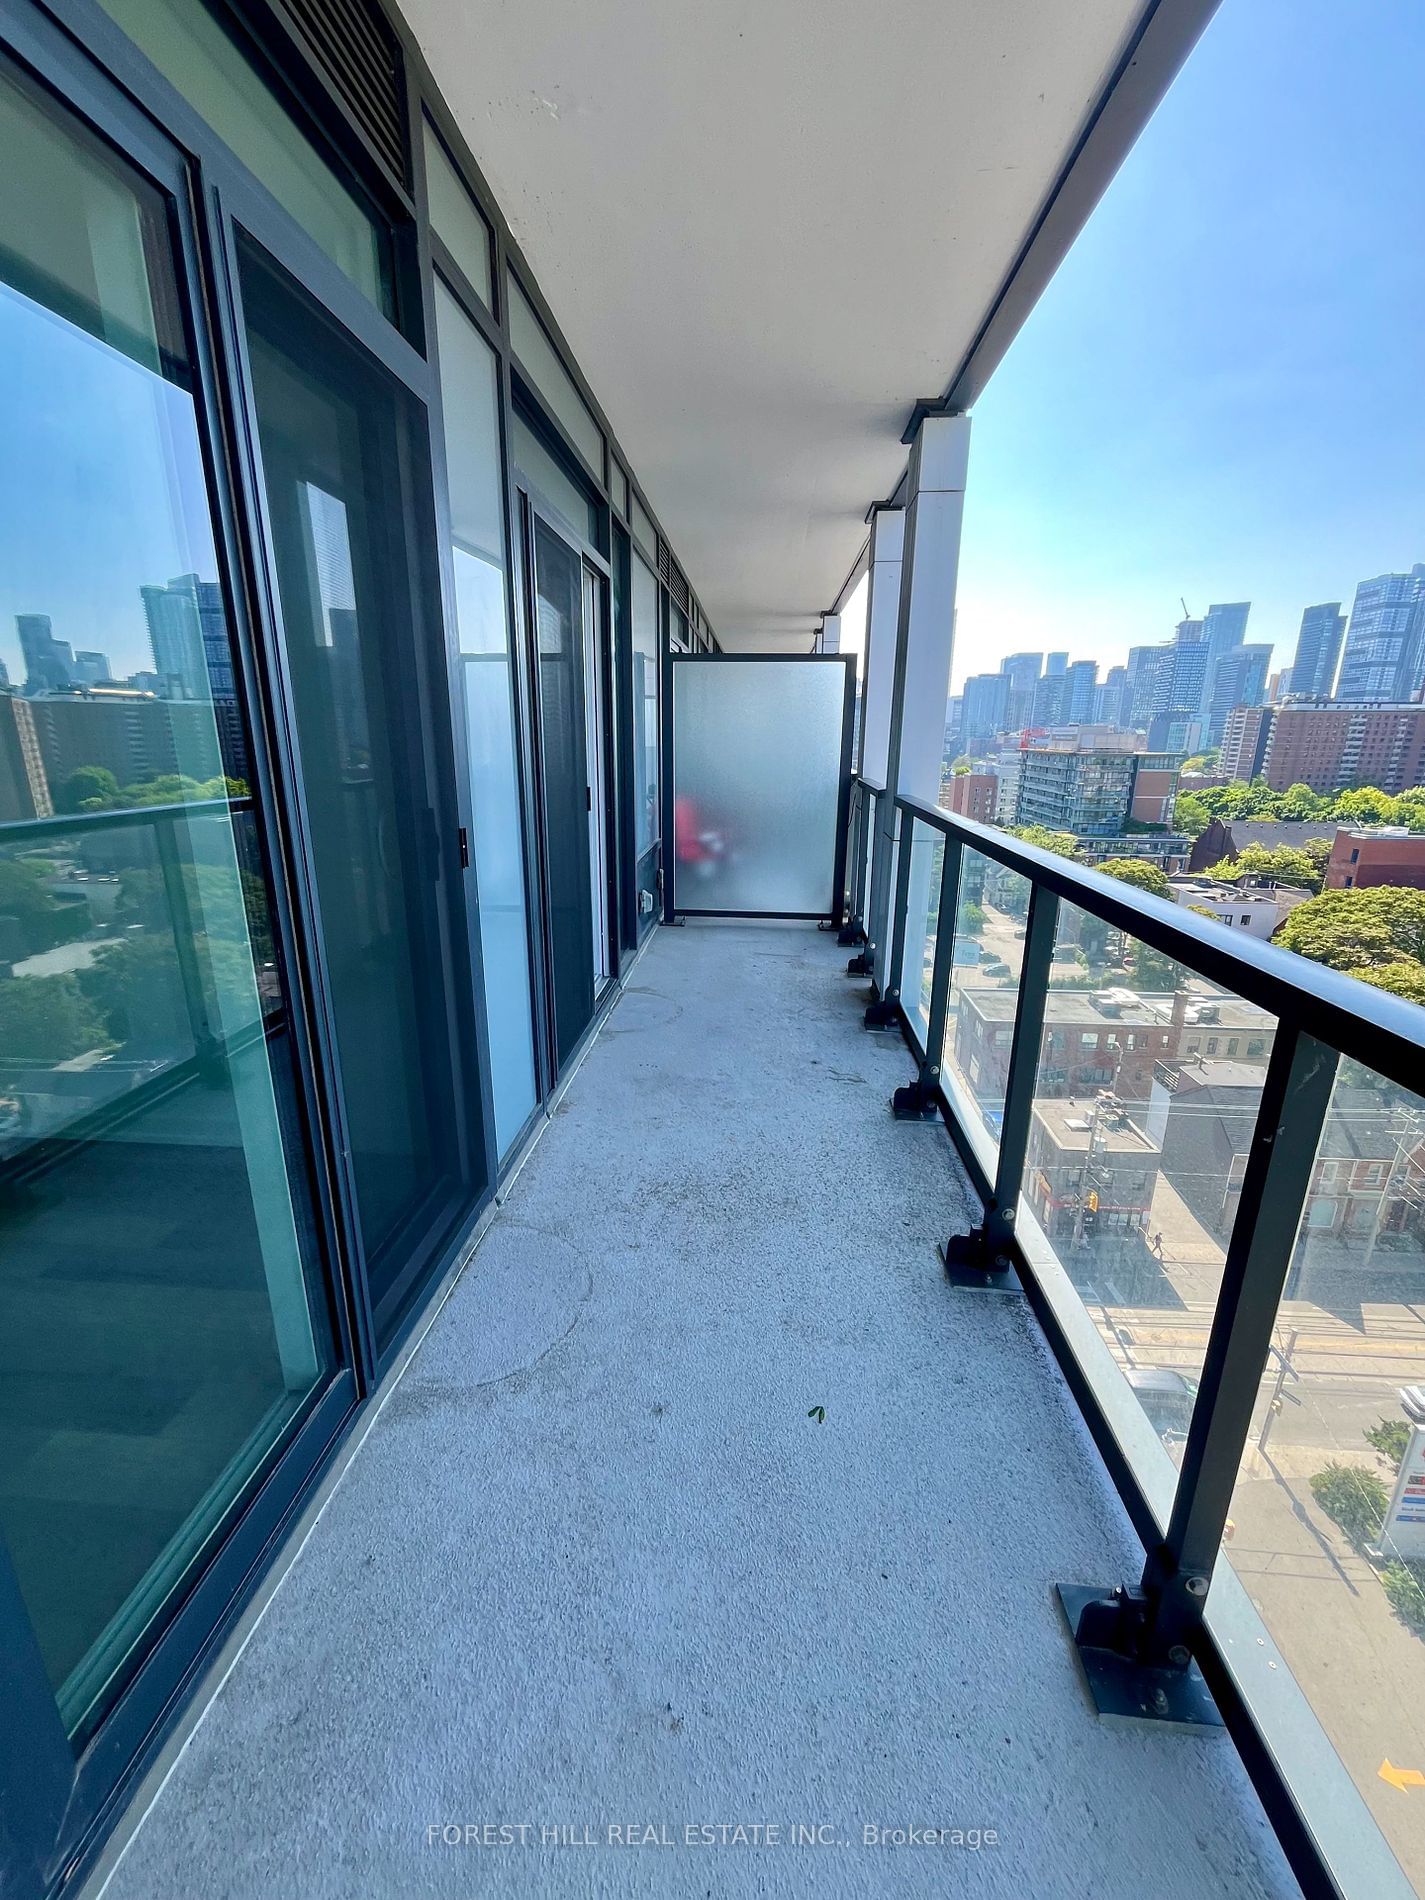
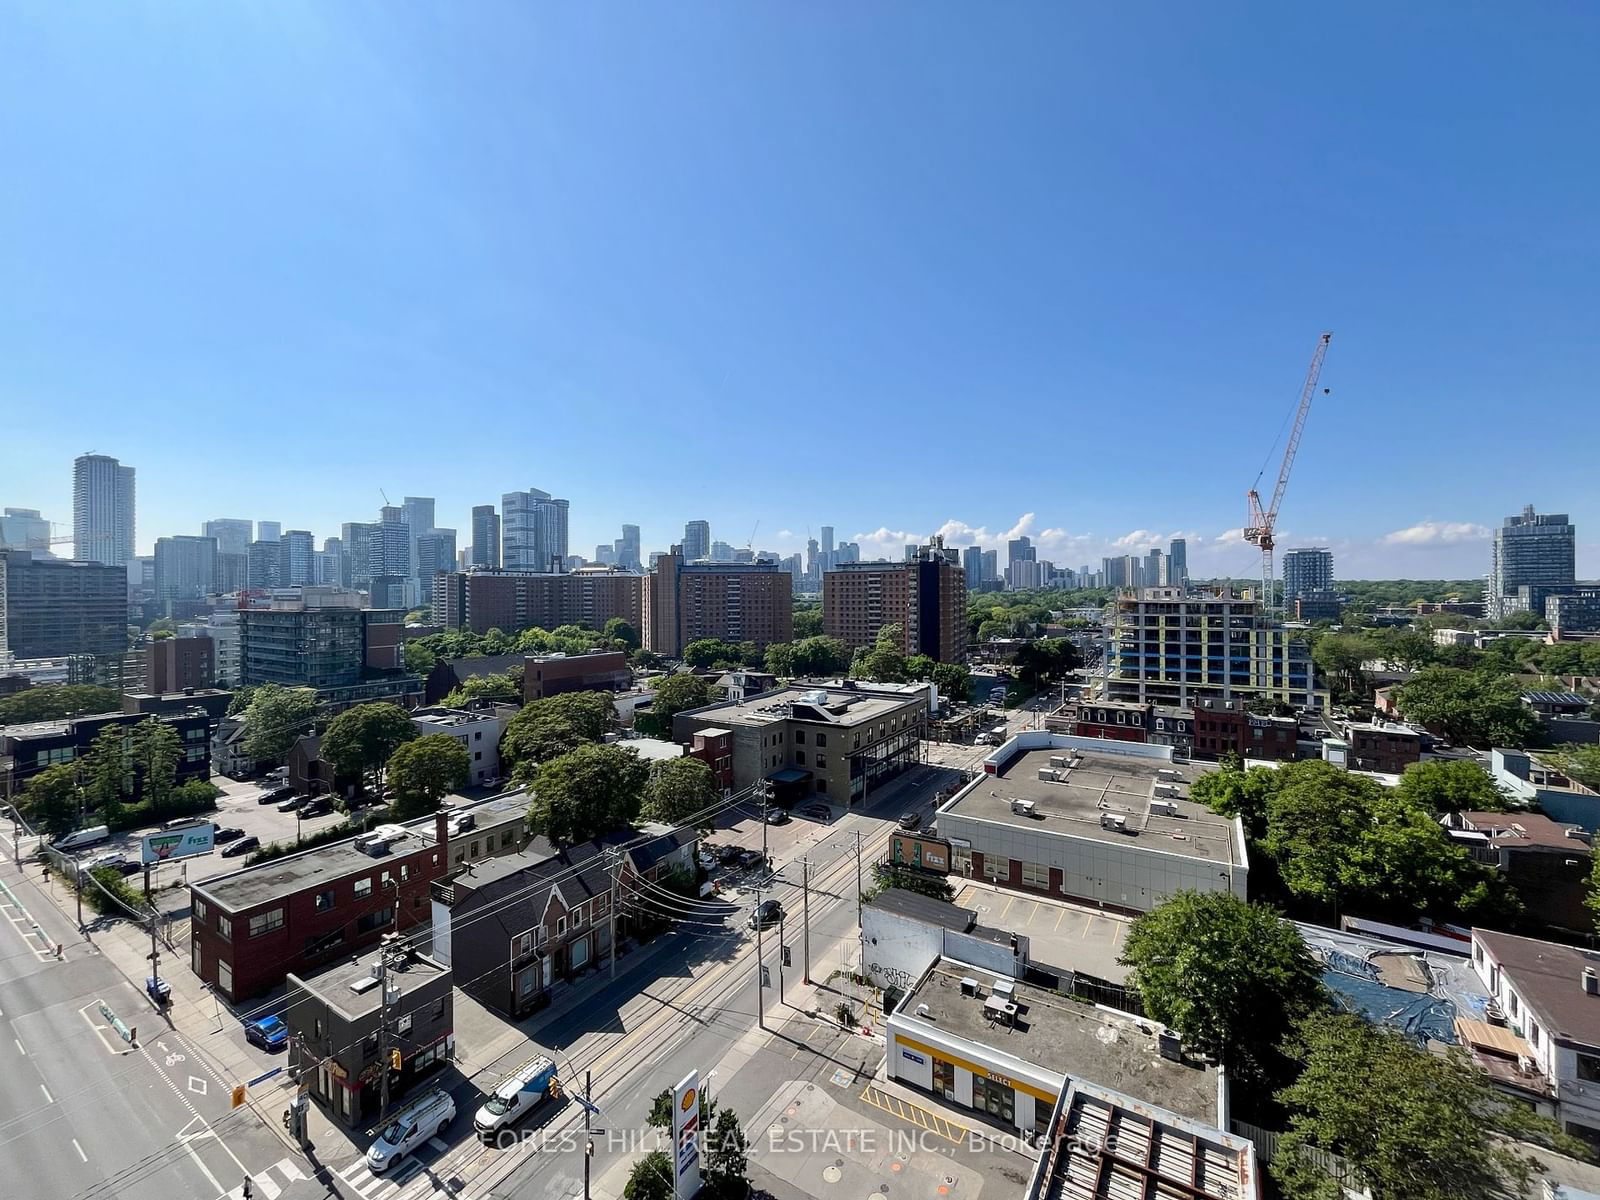
Indulge in the allure of this breathtaking 2-bedroom, 2-bathroom suite boasting stunning 9 ceilings, floor-to-ceiling windows, and spacious balcony offering unobstructed northern views.Freshly painted walls throughout enhance the space, while the modern kitchen with stainless steel appliances adds a touch of sophistication. Built just a few years ago, this suite exudes contemporary charm. Residents enjoy access to a range of amenities including an outdoor swimming pool and terrace, a well-equipped gym, and games room. Located just a short stroll from the vibrant heart of the Distillery District, this home offers convenience at every turn. With grocery stores, cozy cafes, and restaurants within reach. TTC accessibility just steps from the front door, urban living has never been more appealing.
forest hill real estate inc.MLS® #C9019123
Amenities
Explore Neighbourhood
Similar Listings
Demographics
Based on the dissemination area as defined by Statistics Canada. A dissemination area contains, on average, approximately 200 – 400 households.
Price Trends
Maintenance Fees
Building Trends At Home Power + Adelaide Condos
Days on Strata
List vs Selling Price
Offer Competition
Turnover of Units
Property Value
Price Ranking
Sold Units
Rented Units
Best Value Rank
Appreciation Rank
Rental Yield
High Demand
Transaction Insights at 48 Power Street
| Studio | 1 Bed | 1 Bed + Den | 2 Bed | 2 Bed + Den | 3 Bed | 3 Bed + Den | |
|---|---|---|---|---|---|---|---|
| Price Range | No Data | $455,000 - $540,000 | $540,000 - $565,000 | $620,000 - $870,000 | $830,000 | $878,000 - $1,100,000 | No Data |
| Avg. Cost Per Sqft | No Data | $967 | $939 | $1,018 | $1,007 | $902 | No Data |
| Price Range | No Data | $2,000 - $2,400 | $2,100 - $2,600 | $2,450 - $3,800 | $2,900 - $4,200 | $3,600 - $4,500 | $3,050 - $3,800 |
| Avg. Wait for Unit Availability | No Data | 61 Days | 110 Days | 38 Days | 108 Days | 105 Days | No Data |
| Avg. Wait for Unit Availability | No Data | 13 Days | 9 Days | 6 Days | 18 Days | 41 Days | 69 Days |
| Ratio of Units in Building | 1% | 16% | 23% | 39% | 13% | 8% | 3% |
Transactions vs Inventory
Total number of units listed and sold in Corktown - Toronto
