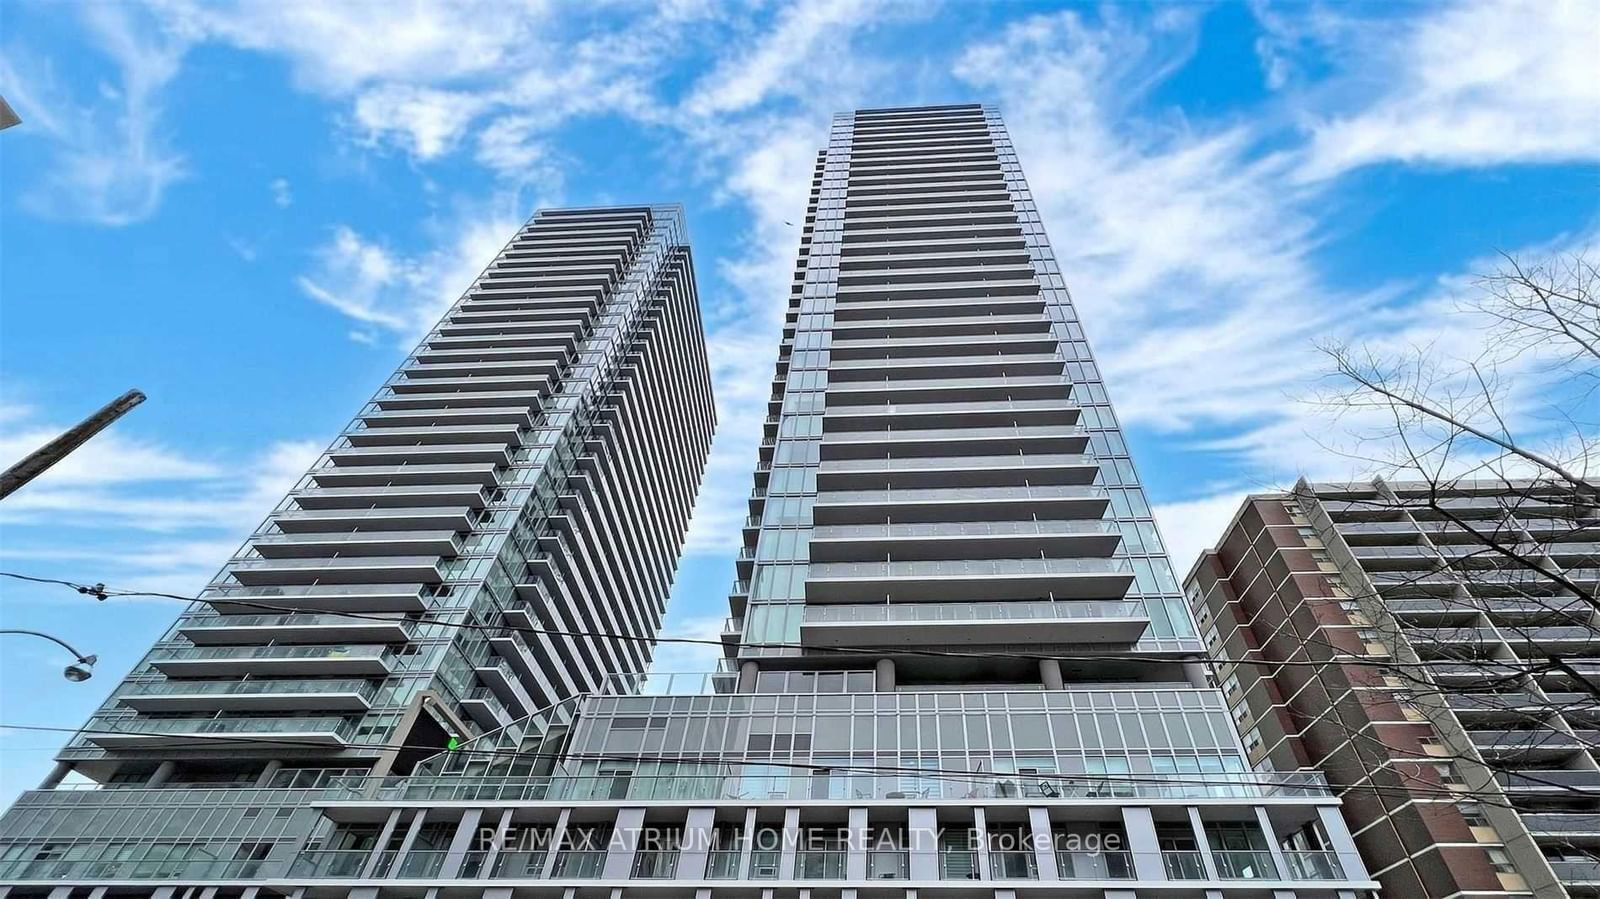
1502 - 195 Redpath Ave
Listing History
Unit Highlights
Maintenance Fees
Utility Type
- Air Conditioning
- Central Air
- Heat Source
- Gas
- Heating
- Forced Air
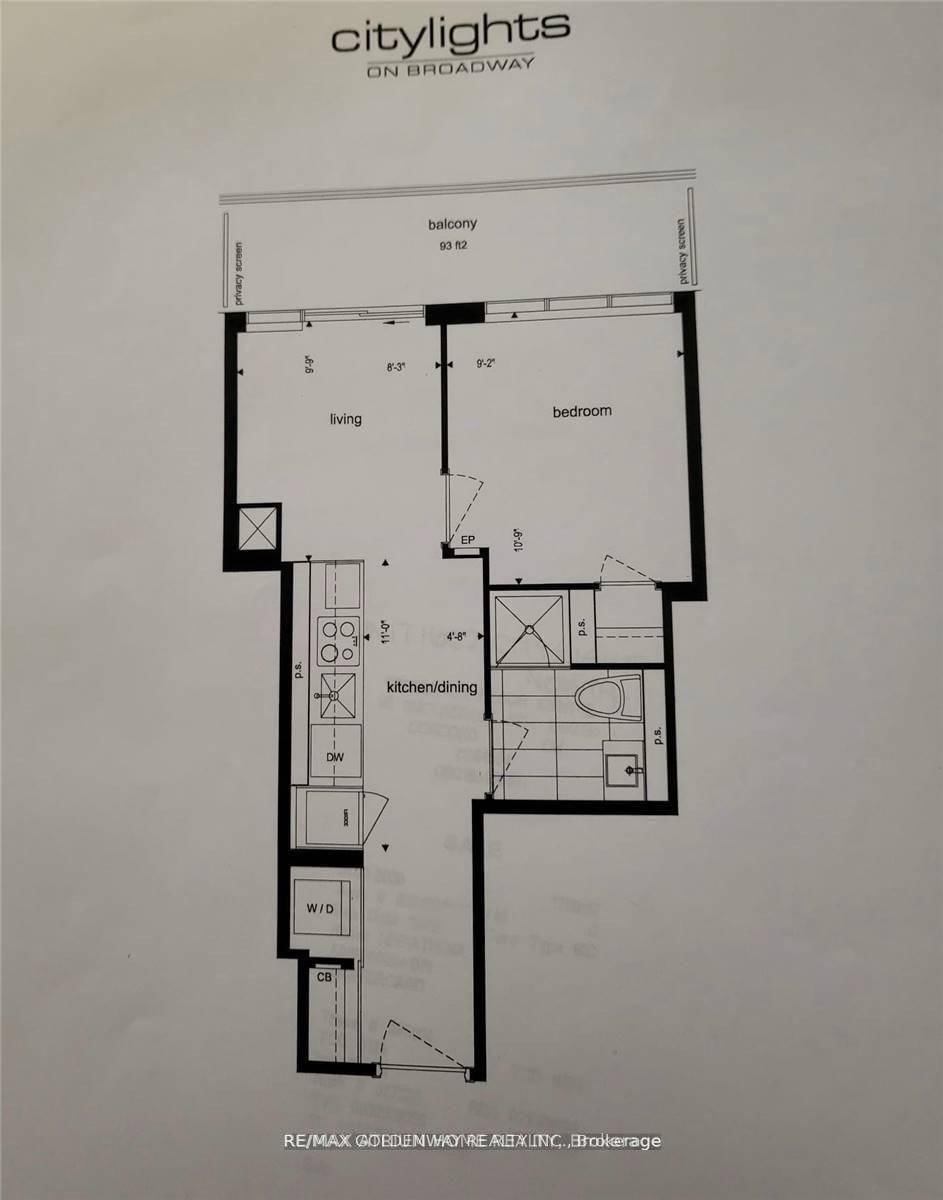
Room Dimensions
About this Listing
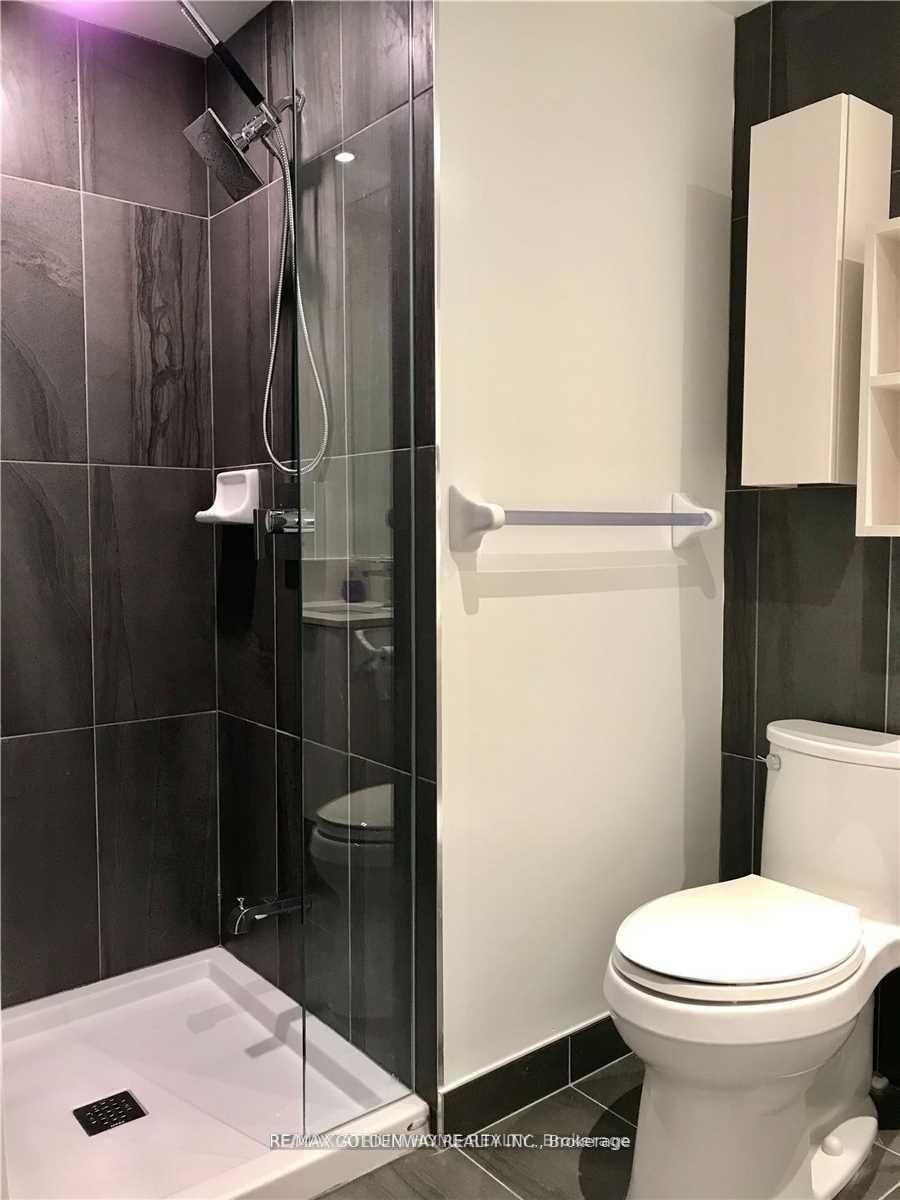
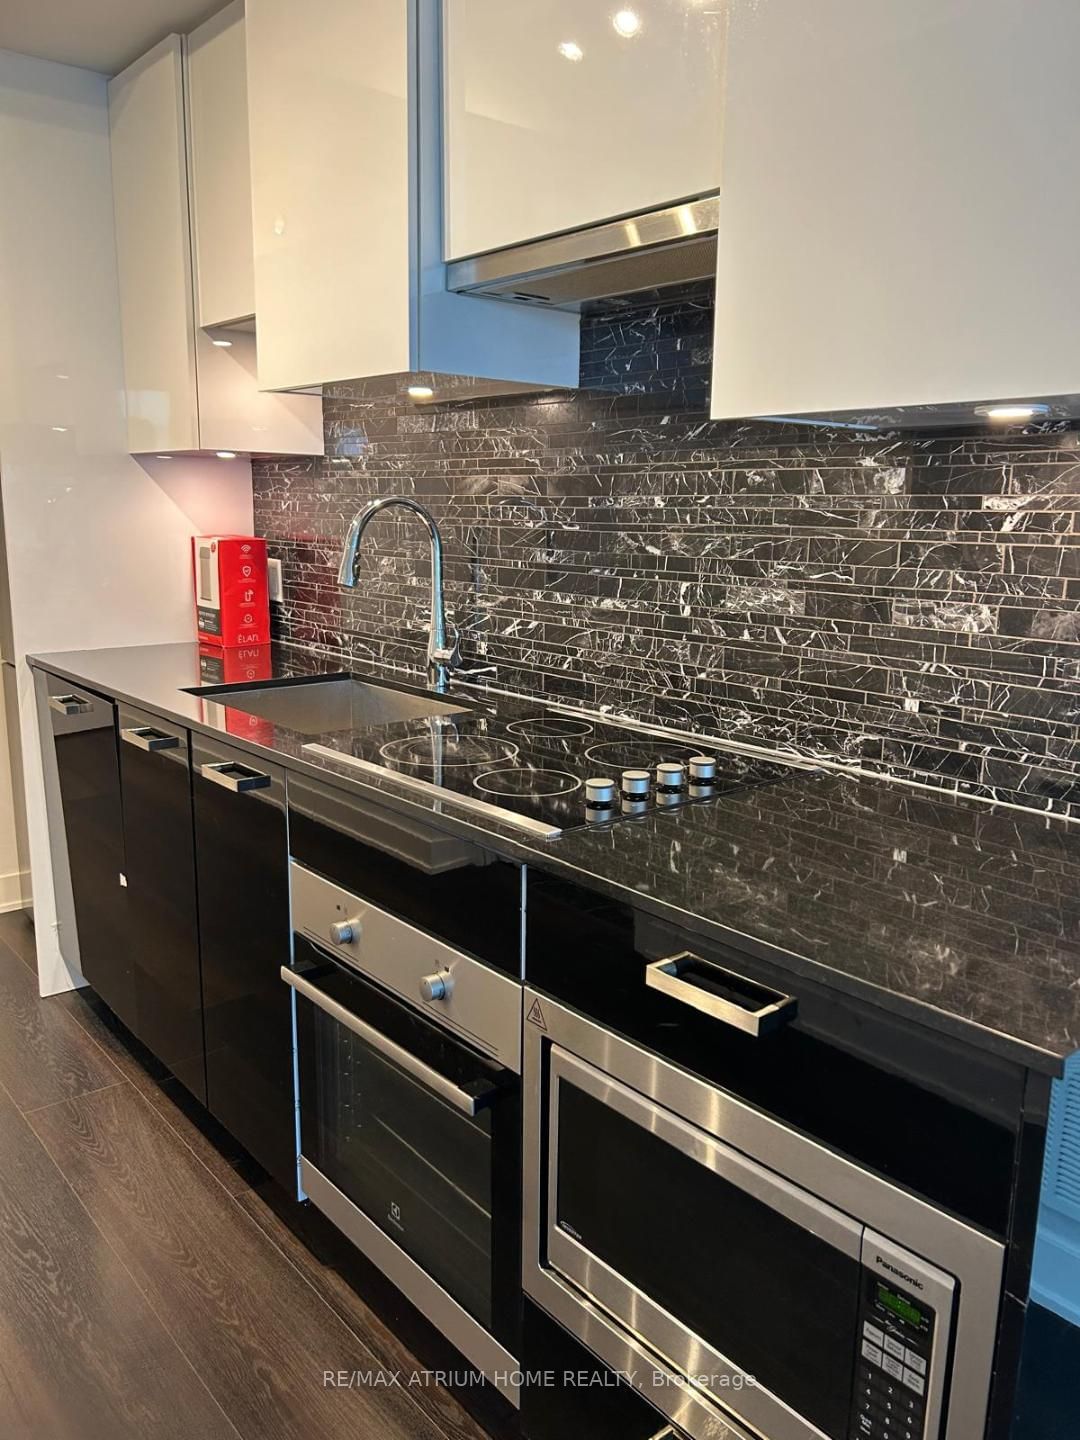
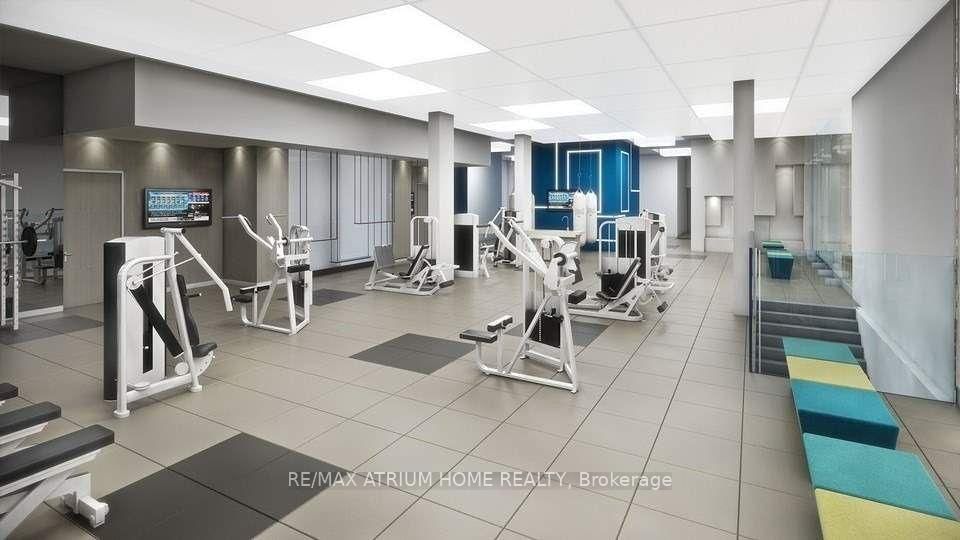
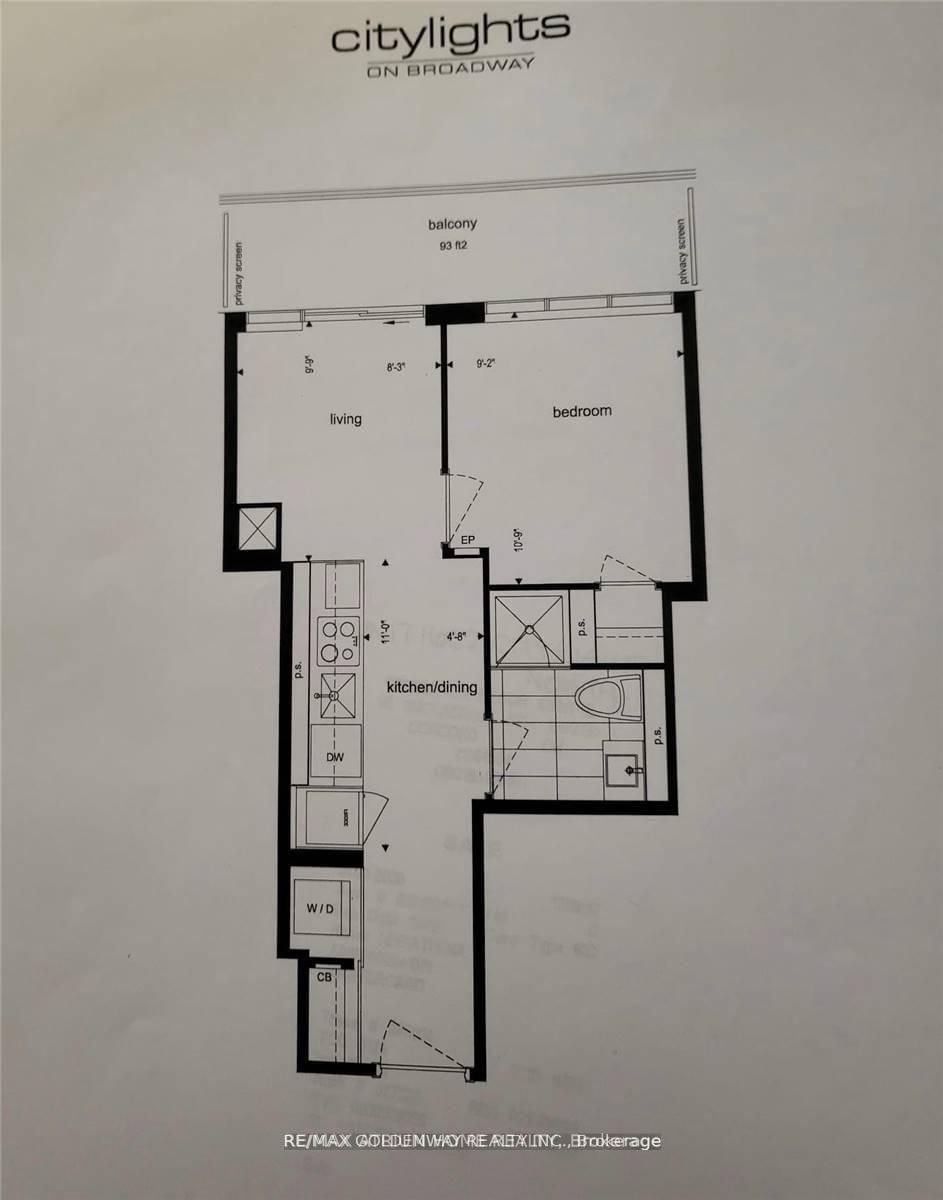
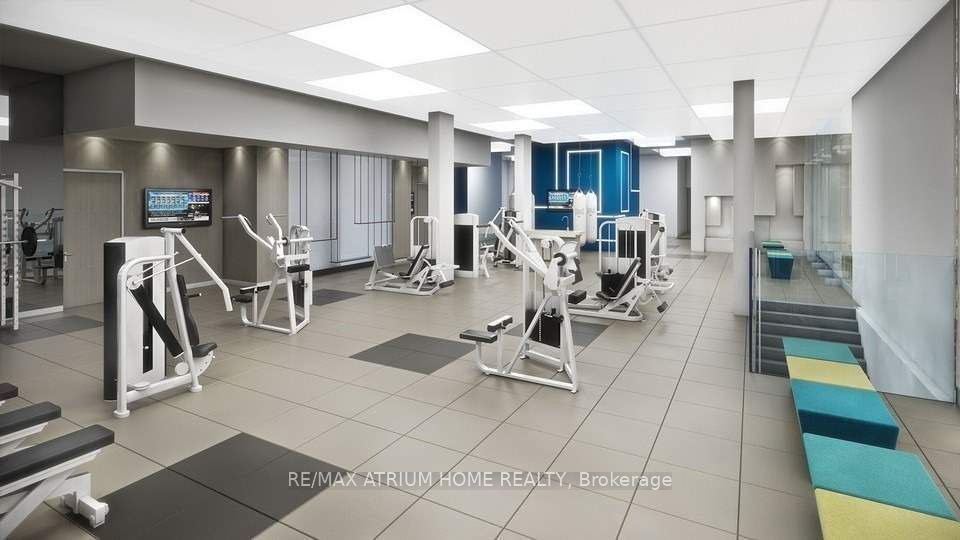
Located In The Heart Of The City In The Highly Sought-After Yonge & Eglinton Neighborhood. Open Concept Unit With 1 Bed, 1 Bath With A Large Balcony And A Locker! Just Steps To World Class Amenities Such As Toronto's New Lrt And Subway, Shopping, Restaurants, Bars, Parks And So Much More. At Your Leisure Your Future Home Is A Walker's Paradise With Excellent Transit And Very Bikeable. Additionally, Enjoy The Broadway Club Which Offers Over 18,000 Sf Of Indoor & Over 10,000 Sf Of Outdoor Amenities Including 2 Pools, Amphitheater, Party Room With Chef's Kitchen, Fitness Centre, Basketball Court, Guest Suites, Roof-Top Lounge With Bbq And More.
Extraslocker is Included. Short Walk To Eglinton Subway & Future Crosstown Lrt at Mount Pleasant. Walk To Many Grocery Stores, Coffee Shops, Great Restaurants, Movie Theatres, Indigo.
re/max atrium home realtyMLS® #C9300688
Amenities
Explore Neighbourhood
Similar Listings
Demographics
Based on the dissemination area as defined by Statistics Canada. A dissemination area contains, on average, approximately 200 – 400 households.
Price Trends
Maintenance Fees
Building Trends At CityLights on Broadway
Days on Strata
List vs Selling Price
Or in other words, the
Offer Competition
Turnover of Units
Property Value
Price Ranking
Sold Units
Rented Units
Best Value Rank
Appreciation Rank
Rental Yield
High Demand
Transaction Insights at 99 Broadway Avenue
| Studio | 1 Bed | 1 Bed + Den | 2 Bed | 2 Bed + Den | 3 Bed | 3 Bed + Den | |
|---|---|---|---|---|---|---|---|
| Price Range | $397,000 - $430,000 | $450,000 - $507,500 | $485,000 - $690,000 | $626,800 - $790,000 | $925,000 | No Data | No Data |
| Avg. Cost Per Sqft | $1,140 | $1,096 | $1,091 | $1,044 | $691 | No Data | No Data |
| Price Range | $1,900 - $2,050 | $2,030 - $2,500 | $2,000 - $2,700 | $2,150 - $3,500 | $3,250 - $4,000 | No Data | No Data |
| Avg. Wait for Unit Availability | 124 Days | 46 Days | 44 Days | 51 Days | 518 Days | No Data | No Data |
| Avg. Wait for Unit Availability | 14 Days | 4 Days | 4 Days | 5 Days | 120 Days | No Data | No Data |
| Ratio of Units in Building | 10% | 29% | 31% | 29% | 2% | 1% | 1% |
Transactions vs Inventory
Total number of units listed and sold in Mount Pleasant West
